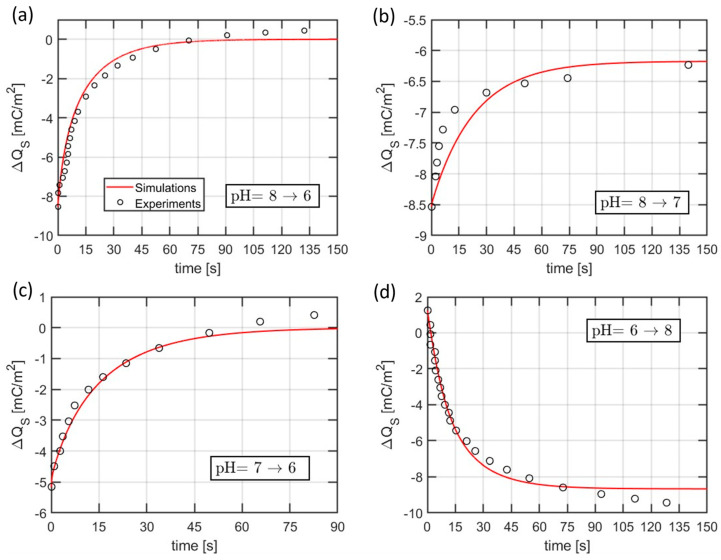
Figure 10.
Model calibration from experimental data in terms of transient surface charge changes upon pH step. The experimental data are taken from the current transients in Figure 9 and are scaled using an arbitrary linear relationship between surface charge and drain current. The values of the employed time constants and are, respectively, 9.5 and 7 s.

