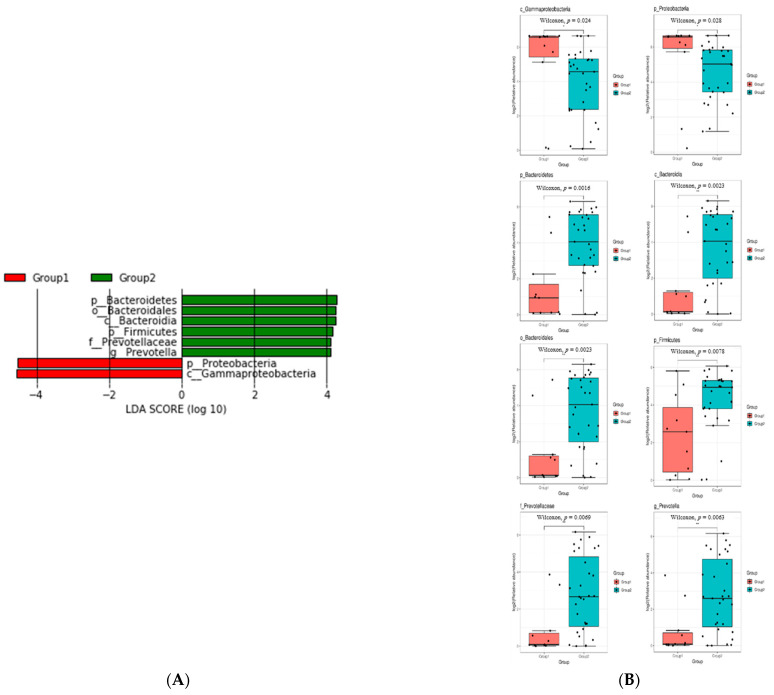
Figure 3.
Comparison of bacterial taxa between acute uncomplicated cystitis and recurrent cystitis, (A) LEfSe analysis showing the bacterial taxa that were significantly different in abundance between the two cystitis groups. The taxa enriched in the acute uncomplicated cystitis group are shown in red with negative linear discriminant analysis (LDA) scores, and the recurrent cystitis group is shown in green with positive LDA scores. Only taxa passing the LDA threshold value of >2.0 are shown, (B) Boxplots showing the log2-transformed relative abundance of eight genera with LDAs above the significant threshold of 3 based on LefSe analysis between the two cystitis groups (* p < 0.05, ** p < 0.01).

