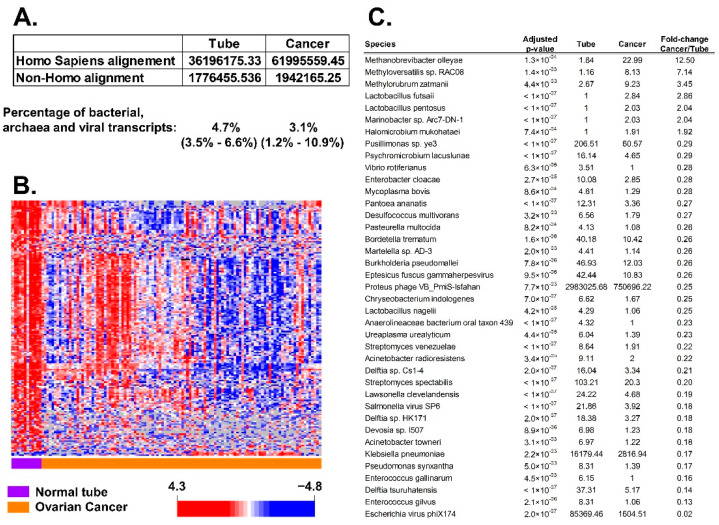
Figure 2.
Differential transcript expression of bacterial, viral, and archaea (BAVT) organisms between normal tube tissue and HGSC: (A) average of aligned transcripts in normal tube and HGSC: percentage of non-human (BAVT) among the total aligned RNA (chis square p-value < 0.001). (B) Heatmap plot of significant differentially expressed BAVT after filtering (>50% missing values). Univariate analysis with multiple comparison adjustment, level of significance is p < 0.005: 202 BAVT were different. In the heatmap there is a general decrease of non-human transcripts in ovarian cancer in comparison with expression in normal tubes. Orange samples: HGSC; purple samples: normal tube. (C) Significant BAVT with largest differential expression between tube and cancer.

