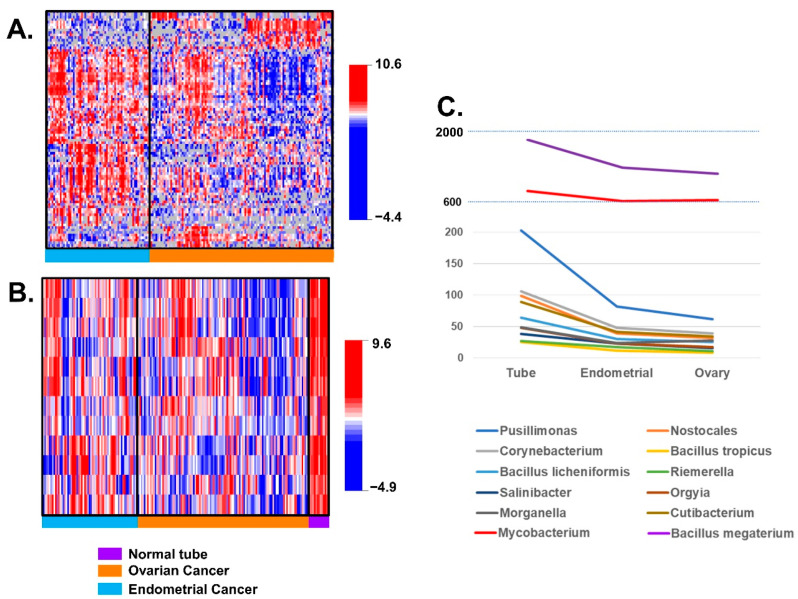
Figure 4.
Differential BVAT expression between HGSC and EEC samples: (A) heatmap plot of significant differential level of expression of BAVT (p < 0.005, for multiple comparison adjustment): blue samples: endometrial cancer; orange samples: ovarian cancer. In general, endometrial cancer level of expression of non-human transcripts was higher than ovarian cancer. 93 of these BAVT were significantly different. (B) Heatmap plot of independently significant non-human transcripts: EEC BAVT expressions are between HGS and normal tubes (blue samples: endometrial cancer; orange samples: ovarian cancer; purple samples: normal tube). (C) Normalized mean expression of independently significant BAVT represented by anatomic location: fallopian tube, endometrium and ovarian. Tube has the highest expression, followed by the EEC except for 2 transcripts, Morganella morganii and Mycobacterium shigaense, where ovarian expression is slighter lower than endometrium.

