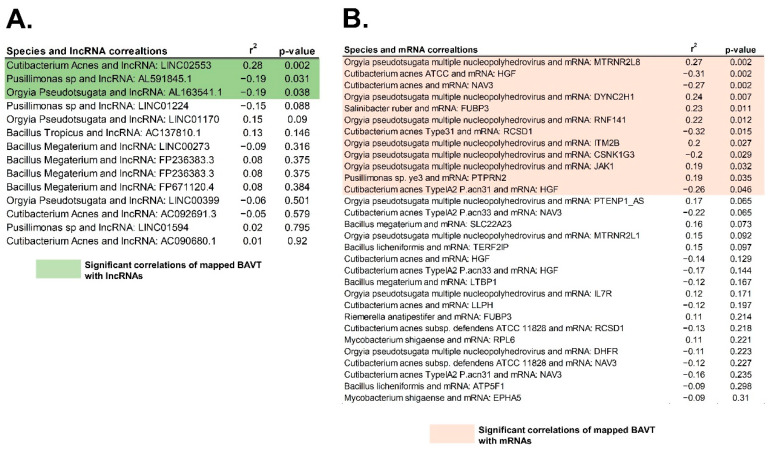
Figure 7.
Correlation of mapped and significant BAVT with lncRNA and gene expression: (A) Correlation of mapped BAVT and lncRNA: highlighted in green are the significant correlations (p < 0.05). (B) Correlation between mapped BAVT and 37 close-by expressed genes (mRNA): in orange, significant correlations (p < 0.05).

