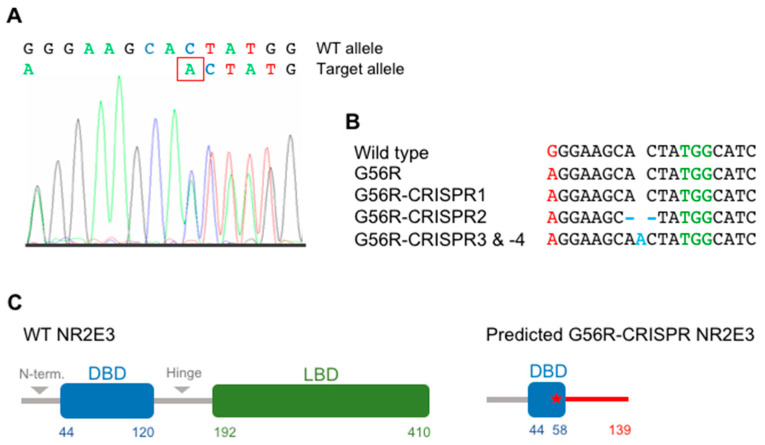
Figure 3.
Generation of G56R-CRISPR iPSC lines. (A) Representative electropherogram of the sequence flanking the DSB site in the DNA of the G56R-CRISPR3 and -4 iPSC clones. The sequence begins at the c.166G>A mutational site. The introduced nucleotide (c.174insA) is boxed in red. (B) Alignment of the Sanger sequencing results for the same region shown in (A) in the wild type, G56R and four G56R-CRISPR IPSC clones. The mutational site is shown in red. The indels are indicated in blue. The PAM sequence is shown in green. (C) Graphical representation of the protein structure of 410 aa WT NR2E3 (left) with the DNA binding domain (DBD) shown in blue, the ligand binding domain (LBD) shown in green and the N-terminus and the hinge region are shown in grey. The predicted effect on NR2E3 (right) following introduction of the frameshift mutation on the G56R (indicated by a red star in the truncated DBD) mutant allele. The red bar indicates a non-NR2E3 protein sequence prior to the premature termination at 139 aa.

