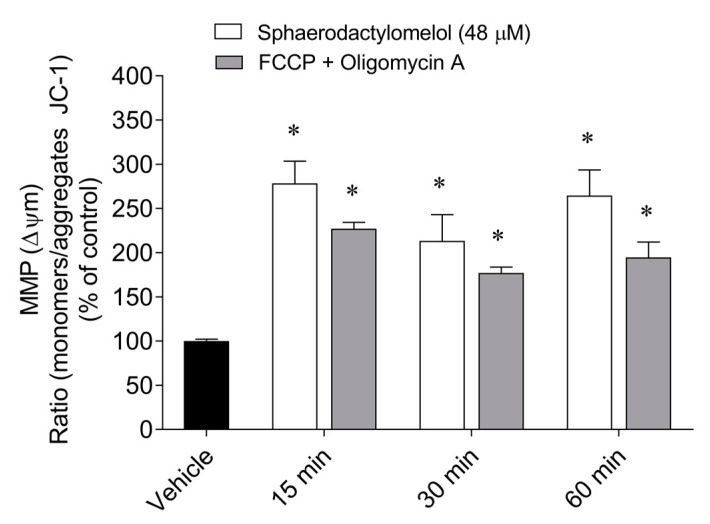
Figure 3.
Mitochondrial membrane potential (MMP) of MCF-7 cells after treatment with sphaerodactylomelol (48 µM) and FCCP (2.5 µM) plus oligomycin A (1 µg/mL) for 15, 30, and 60 min. The results were expressed as the ratio between the monomers/aggregates of JC-1. Values represent the mean ± SEM of three or four independent experiments. Symbols represent significant differences (p < 0.05) when compared to: * control.

