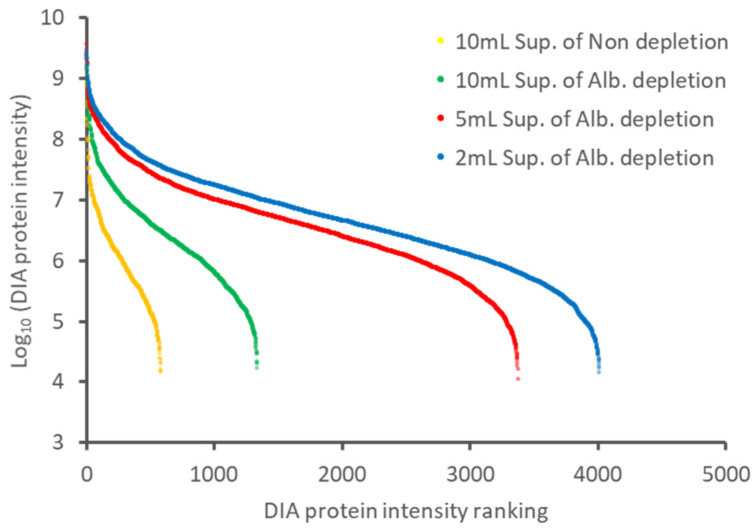
Figure 4.
The dynamic range of protein concentration in the supernatant samples treated with different approaches. The proteins of an average DIA protein intensity in each treated sample were plotted. Yellow dots represent non-depletion of the supernatant cultured in 10 mL of the medium. Green, red, and blue dots represent albumin depletion of the supernatant cultured in 10, 5, and 2 mL of the medium, respectively. Abbreviations: ALB, serum albumin; Sup, supernatant.

