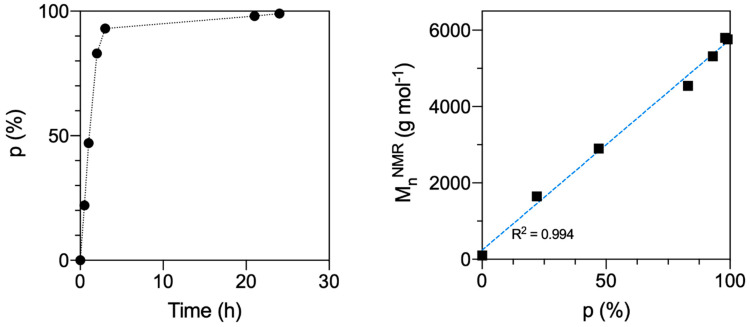
Figure 2.
Plots of TMC conversion calculated from 1H-NMR as a function of time (left), and MnNMR as a function of conversion (right) for the synthesis of the PTMC homopolymer. On the left, in the p (%) vs. time (h) plot the dotted black line is included as a guide to the eye. The MnNMR (g mol−1) vs. p (%) data points were fitted with a linear equation with very high correlation (dashed blue line, R2 = 0.994). The error was typically less than 5% and, thus, the data point symbols are bigger than the error bars. Overall, the kinetic study confirmed the achievement of a high monomer conversion and a good polymerisation control at the reaction conditions.

