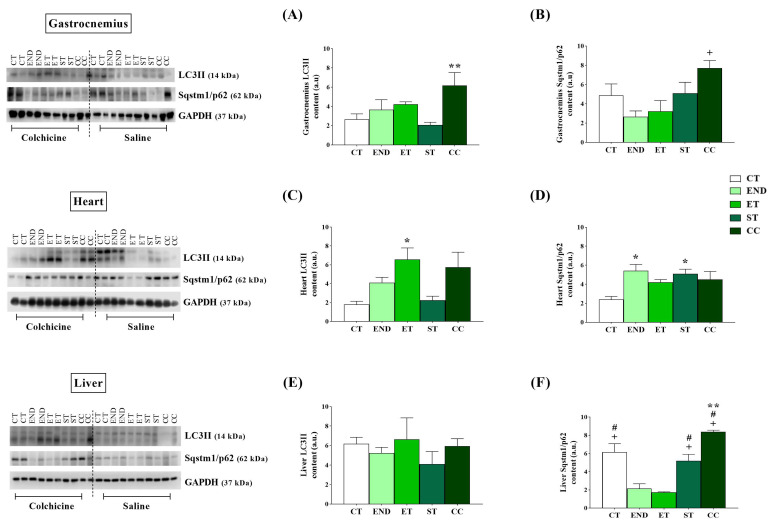
Figure 4.
Gastrocnemius protein levels of LC3II (A) and Sqstm1/p62 (B). Heart protein levels of LC3II (C) and Sqstm1/p62 (D). Liver protein levels of LC3II (E) and Sqstm1/p62 (F), after colchicine treatment. The mean colchicine values were subtracted from the vehicle values (saline) of corresponding protocols for autophagic flux calculation. Data correspond to the mean ± SE of n = 5 mice/group. * p ≤ 0.05 vs. CT; + p ≤ 0.05 vs. END; # p ≤ 0.05 vs.ET; ** p ≤ 0.05 vs. ST for autophagic flux. Control (CT: sedentary); Endurance (END: submitted to the endurance protocol); Exhaustive (ET: submitted to the exhaustive protocol); Strength (ST: submitted to the strength protocol); Concurrent (CC: submitted to the concurrent protocol). Ponceau with full bands and kD are in Supplementary File 2.

