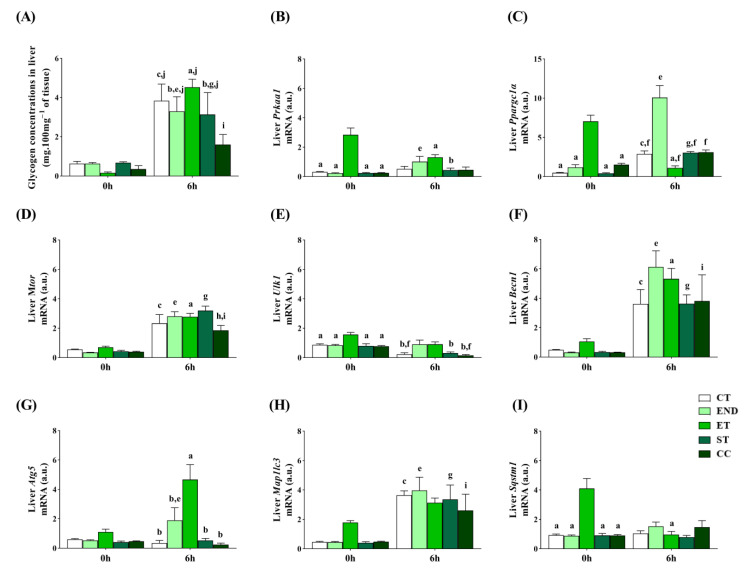
Figure 6.
Glycogen concentrations in the liver (A). Liver mRNA levels of: Prkaa1 (B), Ppargc1a (C), Mtor (D), Ulk1 (E), Becn1 (F), Atg5 (G), Map1lc3b (H), Sqstm1 (I). Data correspond to the mean ± SE of n = 5 mice/group. a p ≤ 0.05 vs. ET at 0 h; b p ≤ 0.05 vs. ET at 6 h; c p ≤ 0.05 vs. CT at 0 h; e p ≤ 0.05 vs. END at 0 h; f p ≤ 0.05 vs. END at 6 h; g p ≤ 0.05 vs. ST at 0 h; h p ≤ 0.05 vs. ST at 6 h; i p ≤ 0.05 vs. CC at 0 h; j p ≤ 0.05 vs. CC at 6 h; Control (CT: sedentary); Endurance (END: submitted to the endurance protocol); Exhaustive (ET: submitted to the exhaustive protocol); Strength (ST: submitted to the strength protocol); Concurrent (CC: submitted to the concurrent protocol).

