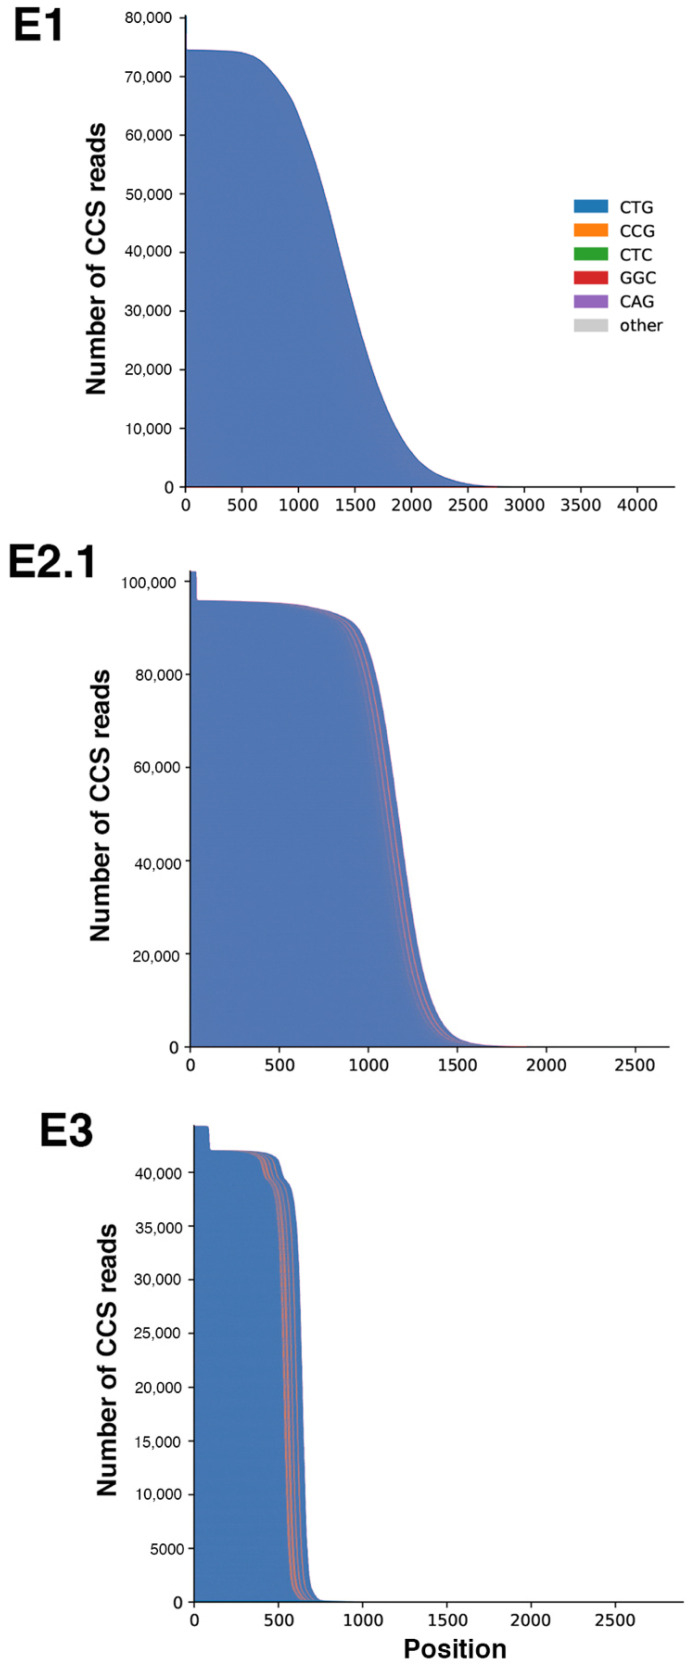
Figure 4.
Waterfall plots outline the repeat structure of the normal and expanded alleles in family E. The y-axis shows the number of circular consensus sequencing (CCS) reads whereas the x-axis shows the length of the CTG repeat expansion in base pairs. The CTG repeat is represented in blue whereas the CCG interruptions are represented in orange. The highest peaks at the far left of the distribution represent the normal allele.

