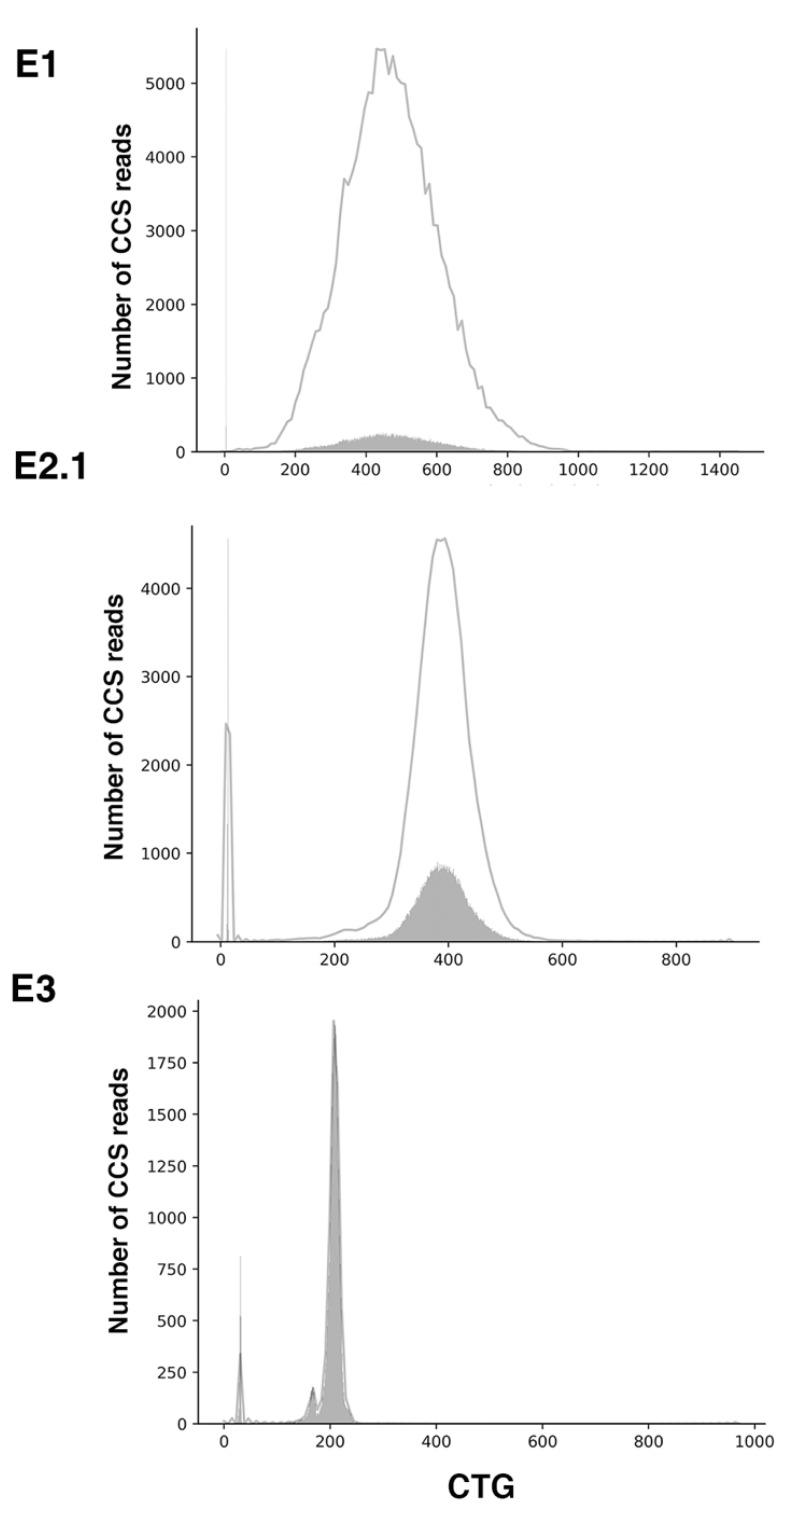
Figure 5.
CTG repeat size distribution in family E. The y-axis shows the number of CSS reads in the solid grey distribution, whereas the x-axis shows the number of CTG repeats. Repeat counting allows to confirm allele sizes for both normal and expanded alleles as well as the extent of mosaicism of the expanded allele. The grey line represents a kernel density estimation of the underlying solid grey distribution of CCS reads.

