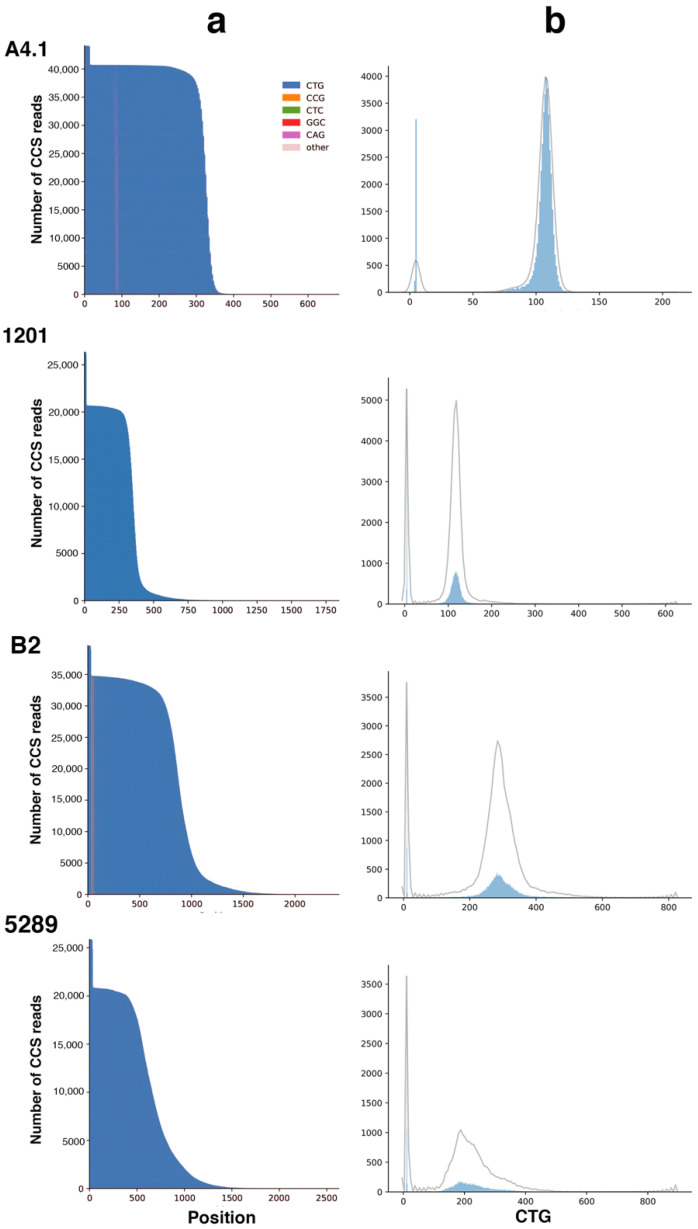
Figure 6.
Long-read sequencing results in four DM1 patients (a)—Waterfall plots outline the repeat structure of the normal and expanded alleles. The y-axis shows the number of CSS reads whereas the x-axis shows the length of the CTG repeat expansion in base pairs. The CTG repeat is represented in blue whereas the CAG interruption is represented in purple and the CCG interruptions are represented in orange. The highest peaks represent the normal allele. (b)—CTG repeat size distribution. The y-axis shows the number of CSS reads in the solid blue distribution, whereas the x-axis shows the number of CTG repeats. The grey line represents a kernel density estimation of the underlying blue distribution of CCS reads. A4.1 (CAG interrupted expansion), B2 (CCG interrupted expansion), 1201 and 5289 carry pure CTG repeat expansions.

