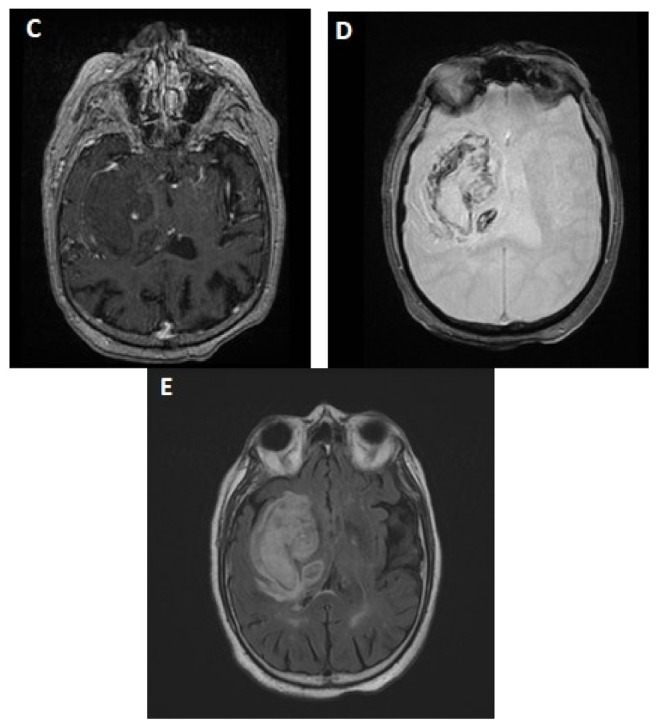
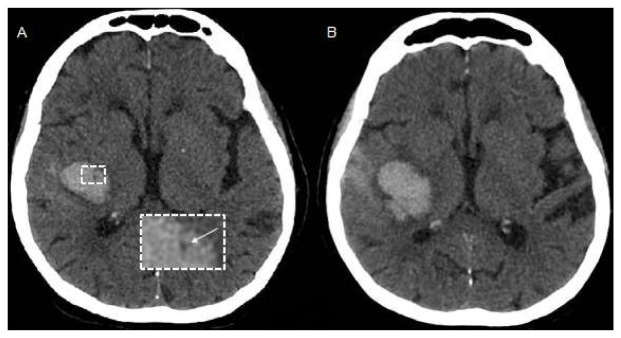
Figure 2.

(A,B): Example of NCCT markers of ICH expansion. (A) Baseline NCCT with evidence of deep ICH and intrahematoma hypodensity (arrow), (B) Follow-up NCCT showing hematoma enlargement. (C–E) illustrate spot sign on T1-weighted post-contrast magnetic resonance imaging (MRI, C) within the ICH shown on susceptibility weighted images (SWI, D) and Fluid Attenuated Inversion Recovery (FLAIR) Sequence (E).

