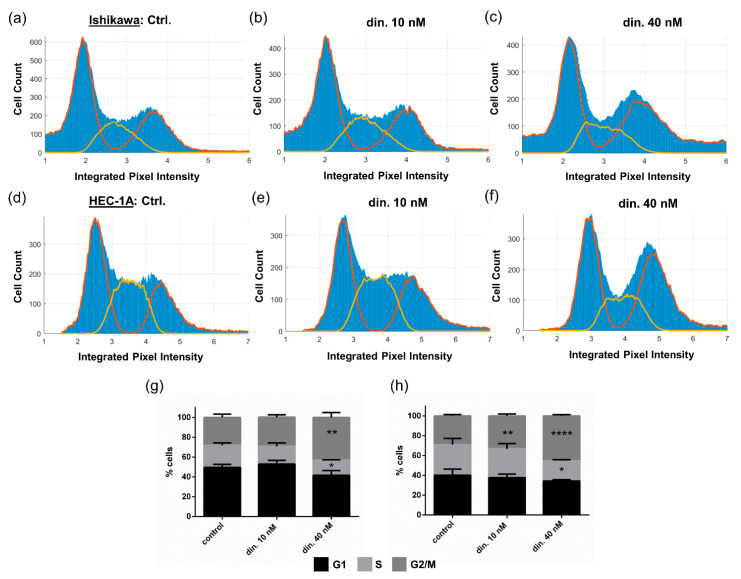
Figure 4.
Dinaciclib inhibits cell cycle progression in Ishikawa and HEC-1A cell lines. Cells were treated with either DMSO, or 10 or 40 nM dinaciclib for 24 h, and the nuclei were stained. Nuclear segmentation and DNA content quantification per cell was performed using Cell Profiler. Histograms show (a) Ishikawa + control (b) Ishikawa + 10 nM dinaciclib, and (c) Ishikawa + 40 nM dinaciclib samples, and (d) HEC-1A + control, (e) HEC-1A + 10 nM dinaciclib and (f) HEC-1A + 40 nM dinaciclib samples. The Watson Pragmatic test was used to define G1 and G2/M peaks (red lines on the histograms) and S-phase peaks (yellow lines). The relative percentages of cells in each cell cycle phase (peak integrals) are shown for (g) Ishikawa and (h) HEC-1A cells. Statistical significance was calculated by ANOVA followed by Dunnett’s test. * p value < 0.05, ** p value < 0.01, **** p value < 0.0001.

