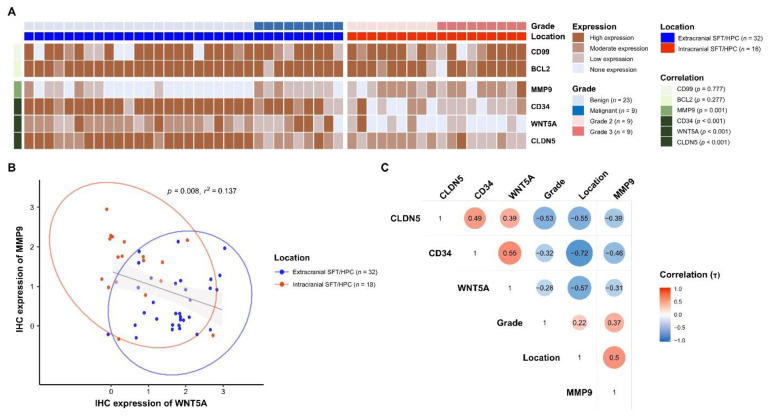
Figure 3.
Analysis of IHC staining of SFT/HPC. (A) Heatmap of IHC expression of BCL2, CD99, MMP9, CD34, WNT5A, and CLDN5, displayed with grades and locations of SFT/HPCs. p-values are for the correlation between location and IHC expression. (B) Linear correlation analysis of IHC expression of MMP9 and WNT5A. Circles represent groupings according to SFT/HPC location. (C) Correlogram of IHC expression of CLDN5, CD34, WNT5A, and MMP9 according to location and grade of SFT/HPC. Red circles indicate a positive correlation between the paired variables and blue circles a negative correlation. The intracranial location was coded as a positive value, and the extracranial location as a negative value.

