Figure 34.

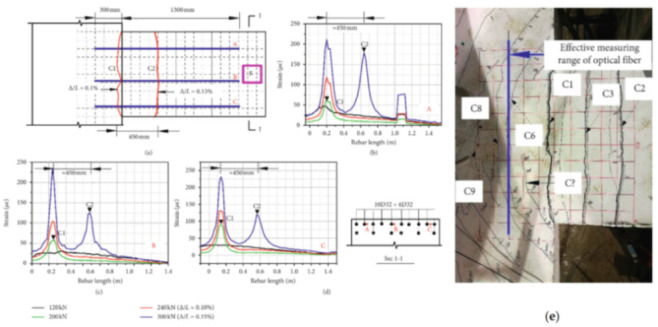
(a) Damage status at 0.15% drift, (b–d) are the strain profiles measured in the top fibers A, B and C at drift levels below 0.15% and (e) picture of the cracked specimen (adapted from [100]).

(a) Damage status at 0.15% drift, (b–d) are the strain profiles measured in the top fibers A, B and C at drift levels below 0.15% and (e) picture of the cracked specimen (adapted from [100]).