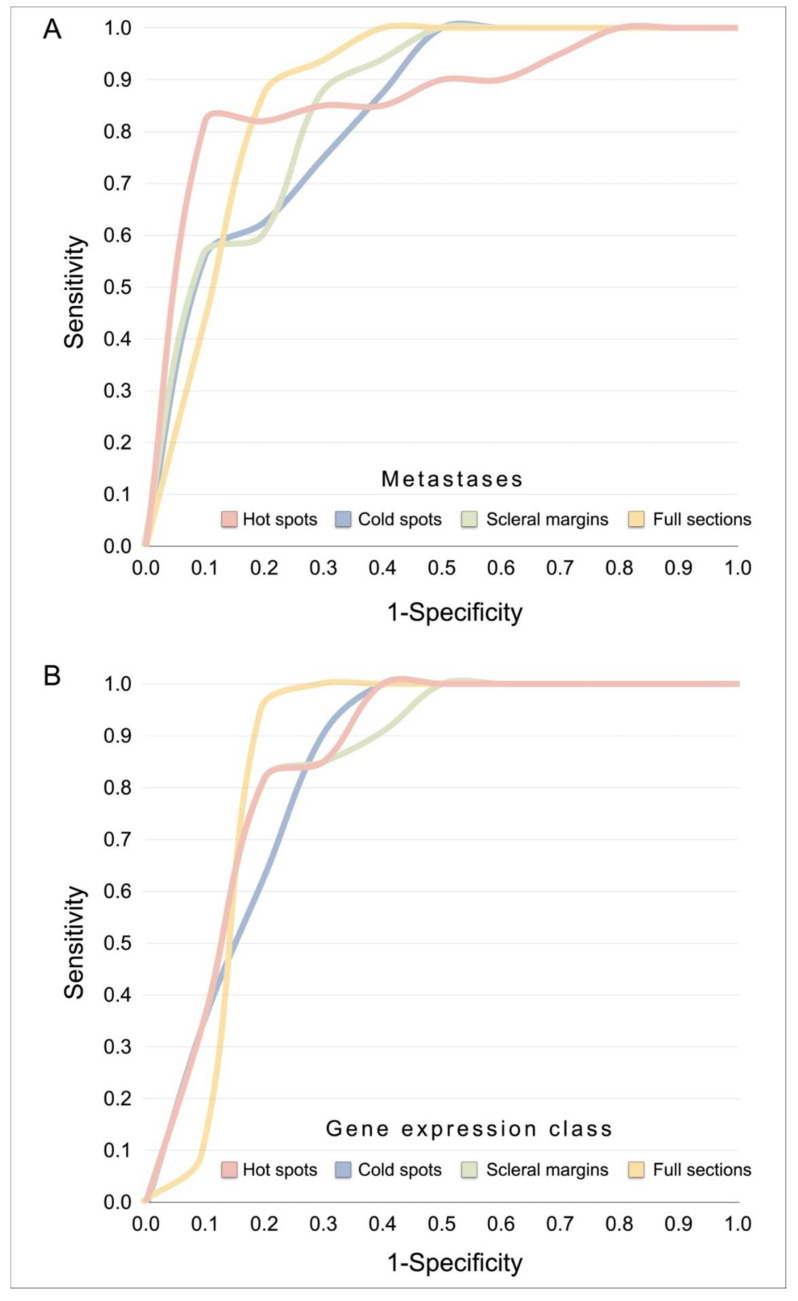
Figure 4.
Receiver operating curves. (A) For metastases, AUCs of 0.86 to 0.89 were achieved, depending on tumor region (p < 0.0001), with sensitivities in the range of 75 to 88% and specificities in the range of 75 to 92%. (B) For gene expression class 2, AUCs of 0.85 to 0.86 were achieved (p = 0.001 to 0.002), with sensitivities in the range of 82 to 100% and specificities in the range of 73 to 83%. See also Table 2. Abbreviations: AUC, area under the curve.

