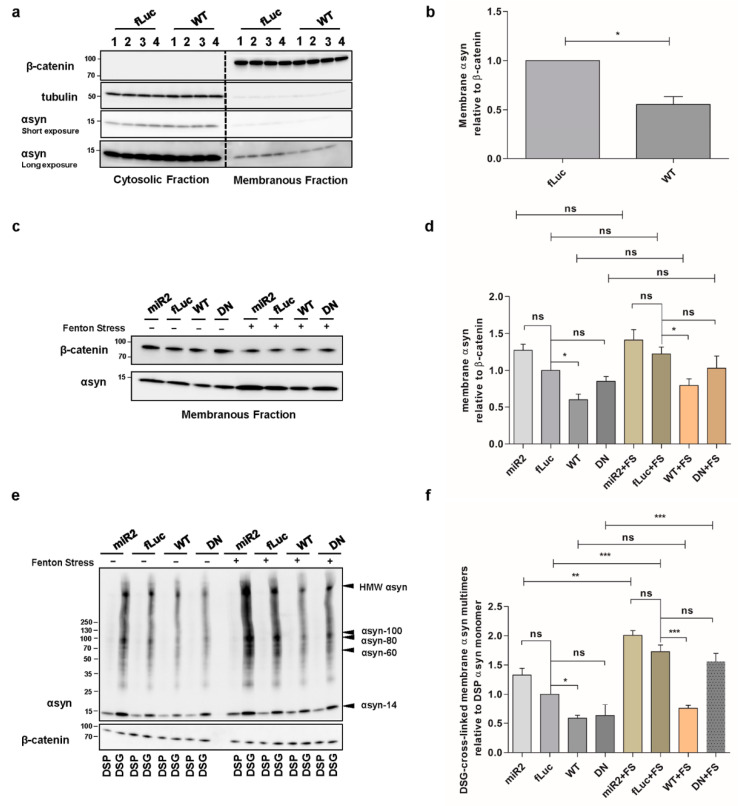
Figure 3.
ATP13A2 regulates αsyn membrane association and multimerization. (a) Analysis of αsyn protein levels by Western blot in the cytosolic and membrane fraction of control and ATP13A2 WT cells using β-catenin as a marker for the membrane fraction and tubulin as a marker for the cytosolic fraction. (b) Quantification of membrane-associated αsyn relative to β-catenin (n = 3). Statistical analysis was performed with column statistics (one-sample t-test) comparing test values to the hypothetical value of 1. The error bars represent the SEM. * p < 0.05. (c) Analysis of αsyn protein levels in the membrane fraction of ATP13A2 KD, control, ATP13A2 WT, and ATP13A2 DN cells without and with oxidative stress by Western blot using β-catenin as a standard. (d) Quantification of membrane-associated αsyn relative to β-catenin (n = 3). Statistical analysis was performed using a one-way ANOVA test with Bonferroni. The error bars represent the SEM. * p < 0.05, ns, not significant. (e) Cell lysates of cross-linked membrane fractions from ATP13A2 KD, control, ATP13A2 WT, and ATP13A2 DN cells without and with oxidative stress. (f) Quantification of ratio of membrane-associated αsyn multimers to DSP-αsyn. Statistical analysis was performed using a one-way ANOVA test with Bonferroni. The error bars represent the SEM. *** p < 0.001, ** p < 0.01, * p < 0.05, ns, not significant.

