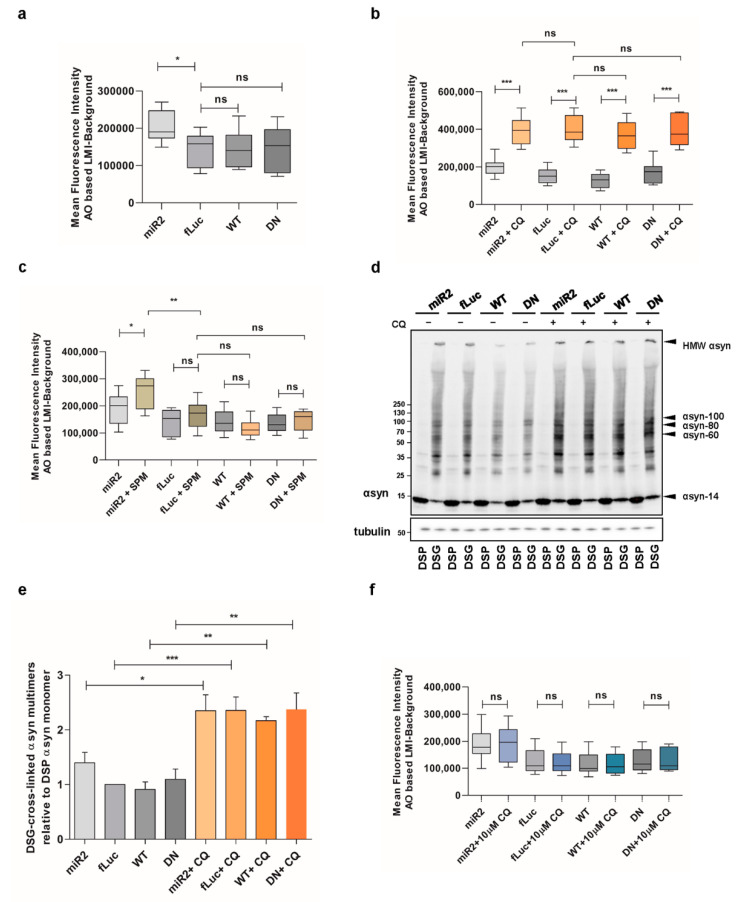
Figure 6.
Impaired lysosomal membrane integrity is linked to αsyn multimerization. (a) Assessment of lysosomal membrane integrity via acridine orange staining in basal conditions (n = 9). Statistical analysis was performed using a one-way ANOVA test with Bonferroni. The error bars represent the SEM. * p < 0.05, ns, not significant. AO = acridine orange, LMI = lysosomal membrane integrity. (b) Assessment of lysosomal membrane integrity via acridine orange staining in ATP13A2 KD, fLuc, ATP13A2 WT, and ATP13A2 DN cells without and with chloroquine (CQ) (n = 9). Statistical analysis was performed using a one-way ANOVA test with Bonferroni. The error bars represent the SEM. *** p < 0.001, ns, not significant. (c) Assessment of lysosomal membrane integrity via acridine orange staining in ATP13A2 KD, fLuc, ATP13A2 WT, and ATP13A2 DN cells without and with SPM (n = 9). Statistical analysis was performed using a one-way ANOVA test with Bonferroni. The error bars represent the SEM. ** p < 0.01, * p < 0.05, ns, not significant. (d) Visualization of αsyn multimers after cross-linking in control cells without and with a high concentration of CQ. (e) Quantification of the αsyn multimer-to-monomer ratio relative to the ratio in the control cells (n = 3). Statistical analysis was performed using a one-way ANOVA test with Bonferroni. The error bars represent the SEM. *** p < 0.001, ** p < 0.01, * p < 0.05. (f) Assessment of lysosomal membrane integrity via acridine orange staining in ATP13A2 KD, fLuc, ATP13A2 WT, and ATP13A2 DN cells without and with a low concentration of CQ (n = 9). Statistical analysis was performed using a one-way ANOVA test with Bonferroni. The error bars represent the SEM. ns, not significant.

