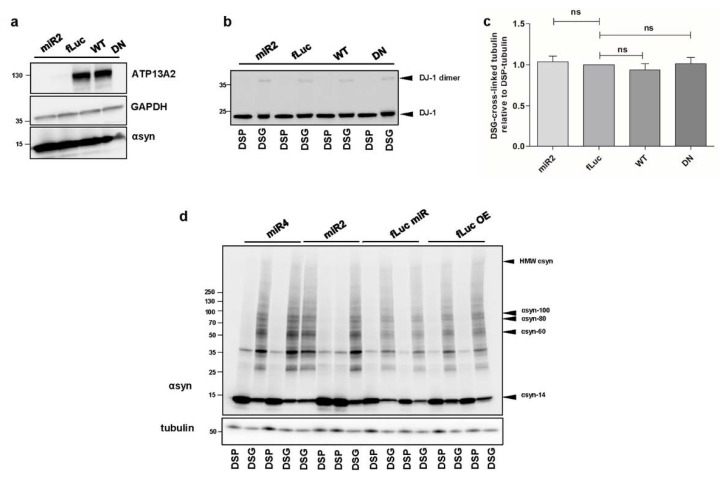
Figure A1.
(a) Visualization of ATP13A2 and αsyn levels in ATP13A2 KD, fLuc, ATP13A2 WT, and ATP13A2 DN cells using GAPDH as a standard. (b) Visualization of DJ-1 dimers after cross-linking in ATP13A2 KD, fLuc, ATP13A2 WT, and ATP13A2 DN cells. (c) Quantification of the ratio of DSG cross-linked tubulin (~55 kDa) to DSP tubulin (~55 kDa) in the ATP13A2 KD, ATP13A2 WT, and ATP13A2 DN cells relative to the ratio in the control cells (n = 4). Statistical analysis was performed using a one-way ANOVA test with Bonferroni. The error bars represent the SEM. ns, not significant. (d) Visualization of αsyn multimers after cross-linking in ATP13A2 miR4 (a second ATP13A2 sh sequence), ATP13A2 miR2, fLuc miR, and fLuc overexpression cells.

