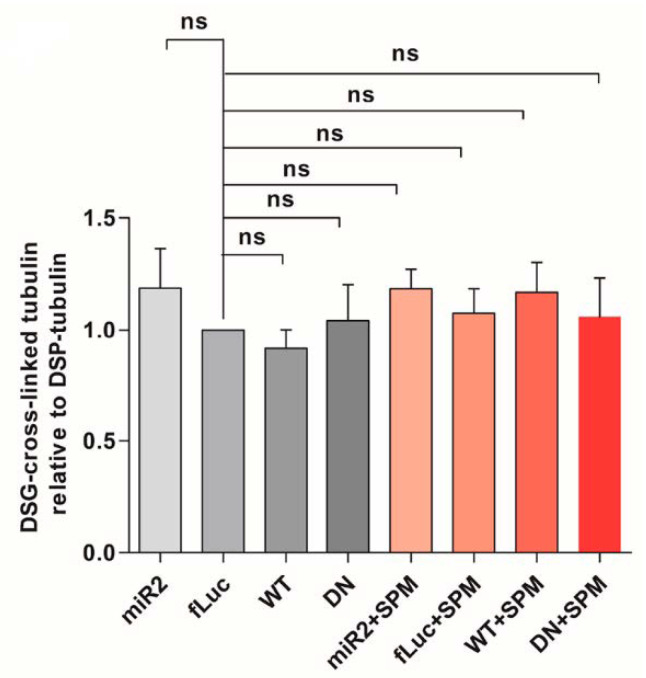
Figure A4.
Quantification of ratio of DSG cross-linked tubulin (~55 kDa) to DSP tubulin (~55 kDa) in SPM-treated cells relative to the ratio in the untreated control cells (n = 3). Statistical analysis was performed using a one-way ANOVA test with Bonferroni. The error bars represent the SEM. ns, not significant.

