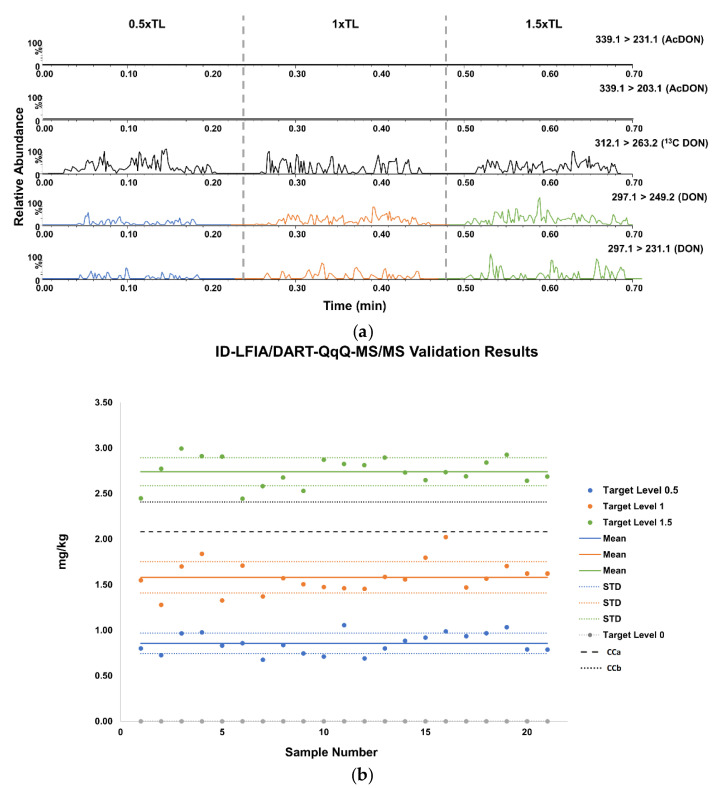
Figure 5.
(a). Representative chronograms for DON-spiked wheat samples used to develop the ID-LFIA, retrieved in dissociation solution and analyzed by DART-QqQ-MS/MS, demonstrating the three distinct spiking levels in blue 0.5× TL, orange 1× TL, and green 1.5× TL. 13C15 DON is added as an internal standard before the MS/MS analysis. (b). Data analysis of 21 blank wheat samples, and spiked versions thereof in ID-LFIA/DART-QqQ-MS/MS, at three target level concentrations in blue 0.5× TL, orange 1× TL, and green 1.5× TL.

