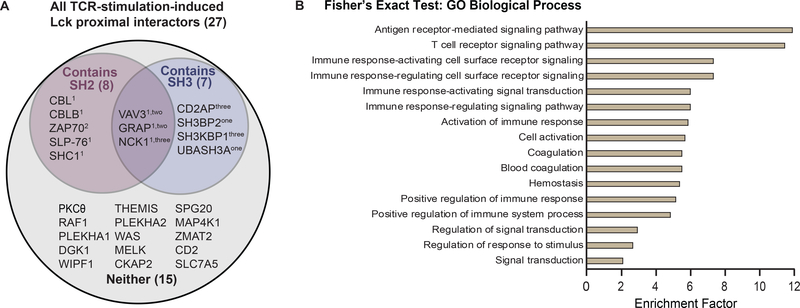
Figure 7: Additional validation of Lck-TurboID proteomic data.
(A) InterProScan motif analysis of proteins with significantly increased interaction with Lck. Venn diagram of the proteins with enhanced association with Lck upon TCR stimulation containing SH2 domain, SH3 domain, both, or neither. The number of the corresponding domain present in each protein is indicated as a superscript. (B) GO Biological Process of significantly changing proteins. Fisher’s exact test was performed on the proteins that are significantly changing to determine if there is a non-random association between these protein groups and all terms in the Gene Ontology biological process (GOBP). The top 16 enriched pathways alongside their enrichment factors were plotted accordingly. Proteins which are categorized under each pathway are listed in Table S5.

