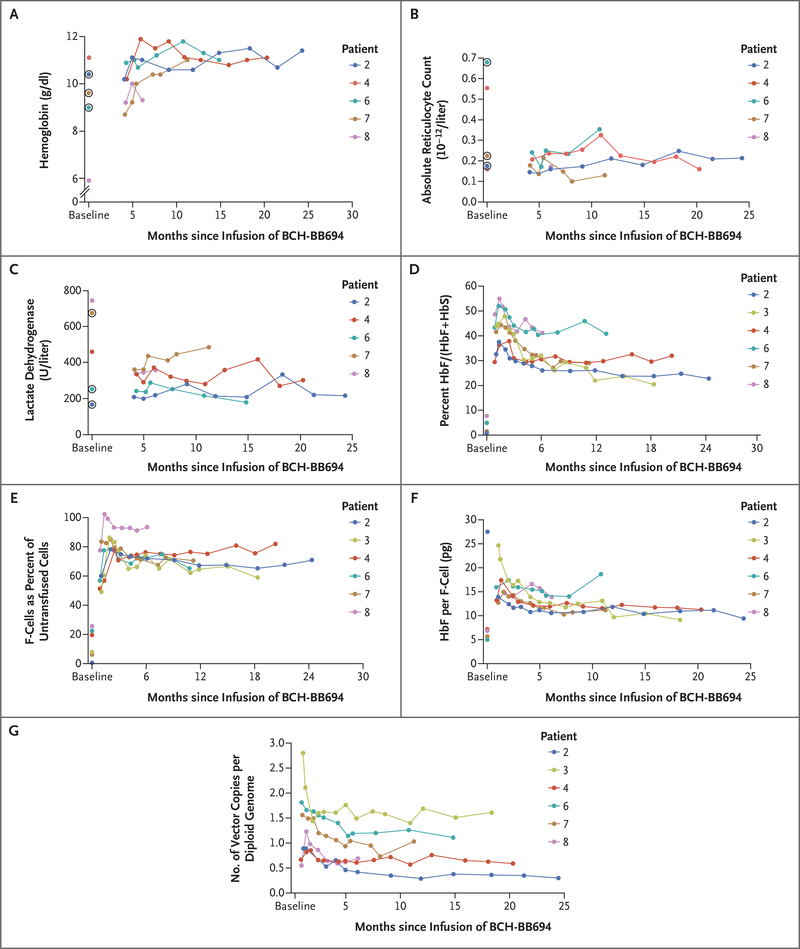
Figure 1. Fetal Hemoglobin Induction and Gene Marking after Gene Therapy.
Panel A shows hemoglobin (Hb), Panel B absolute reticulocyte count (ARC), and Panel C lactate dehydrogenase over time after infusion. In Panels A, B, and C, circled dots indicate the presence of transfused red cells at the time of the baseline sample. In these three panels, Patient 3 is not shown owing to reinitiation of regular red-cell transfusions. Panel D shows HbF as a percent of HbF + HbS at various times after infusion. Panel E shows the percent of F-cells (circulating untransfused red cells that express HbF) at various times after infusion. In Panels A through F, the baseline values shown indicate the values before gene therapy, which are the latest samples collected before cell infusion for which relevant data are available. Patients 2, 3, and 7 at the baseline time point were receiving regular transfusions; for Patient 4, the baseline time point is 2 months after hydroxyurea was discontinued and after 3 months of pre–gene therapy exchange transfusions; for Patient 6, the baseline time point is 2 weeks after hydroxyurea was discontinued and 1 month after a transfusion given for clinical indications; and Patient 8 at the baseline time point was receiving hydroxyurea before starting pre–gene therapy transfusions. Panel G shows the whole-blood vector copy number in peripheral blood for each of the six patients at various times after infusion.

