
FIGURE 3:
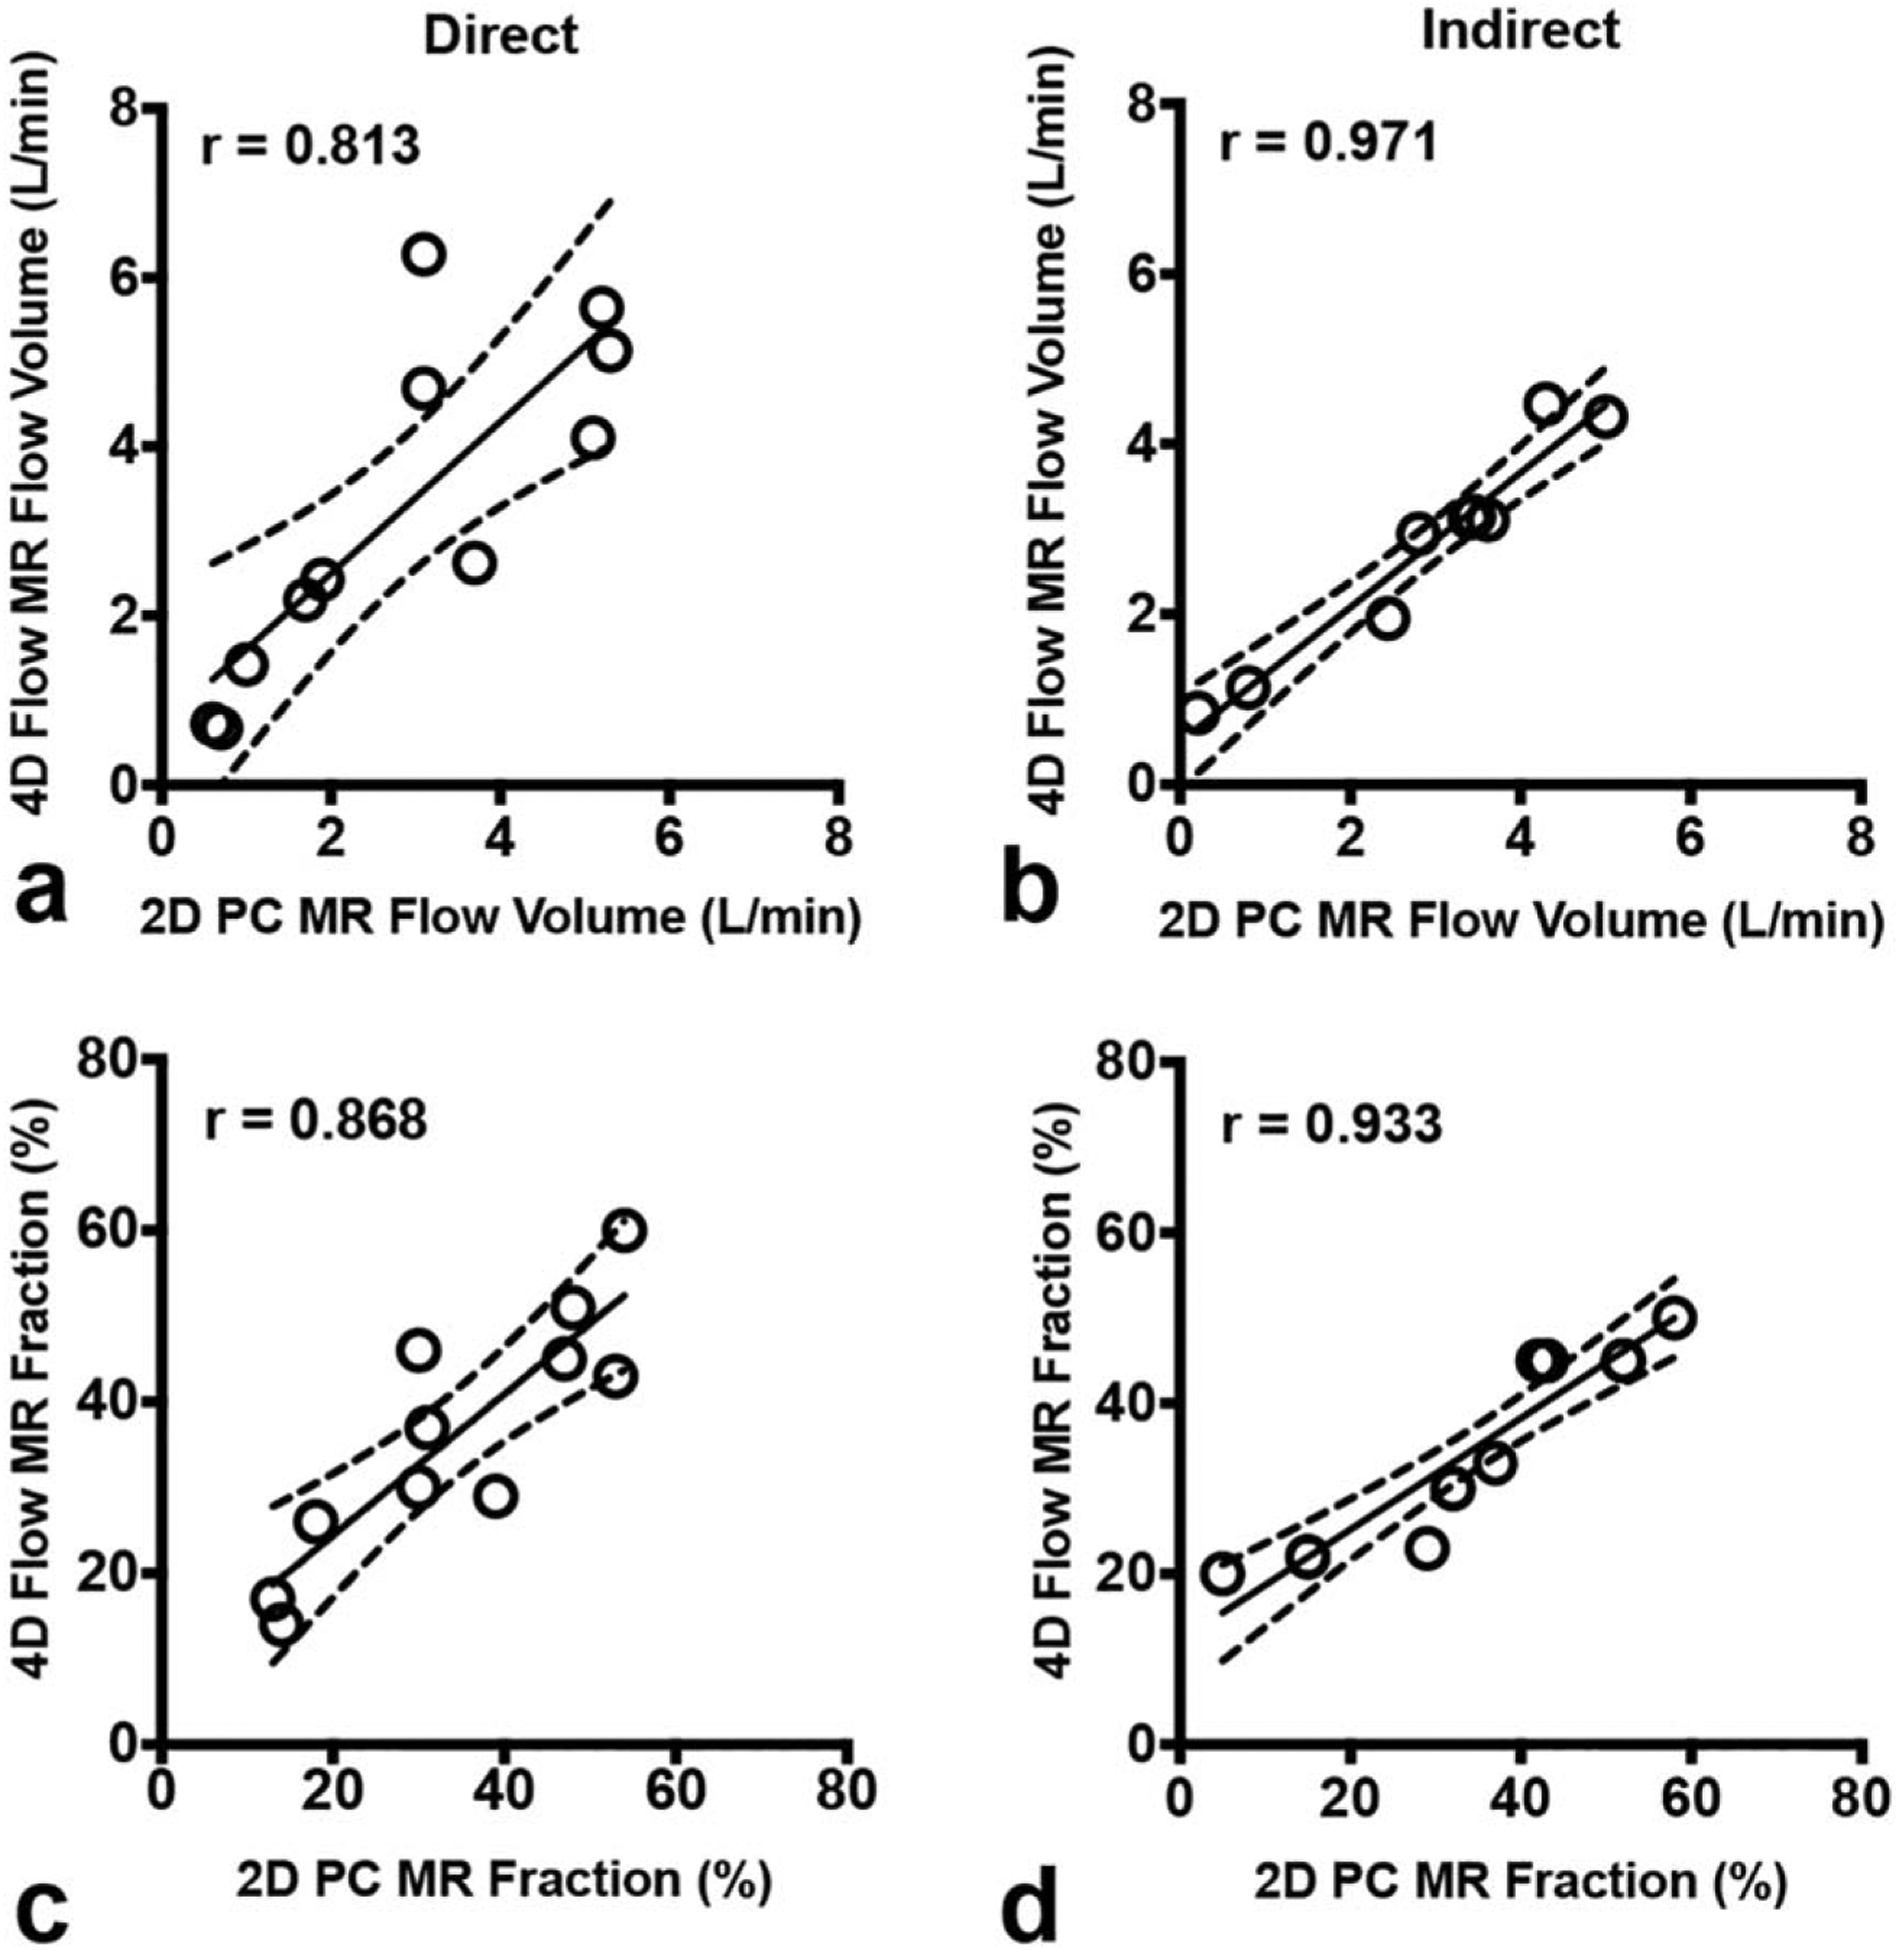
Comparison of 4D flow vs. 2D-PC for quantification of MR. Scatterplots demonstrate high consistency for both direct (left panels) and indirect (right panels) methods of quantifying regurgitant flow volume (top panels) and regurgitant fraction (bottom panels). The solid line is the line of best fit using least squares method. The dashed lines indicate the asymptotic 95% confidence intervals (CI). r = Pearson correlation coefficient.