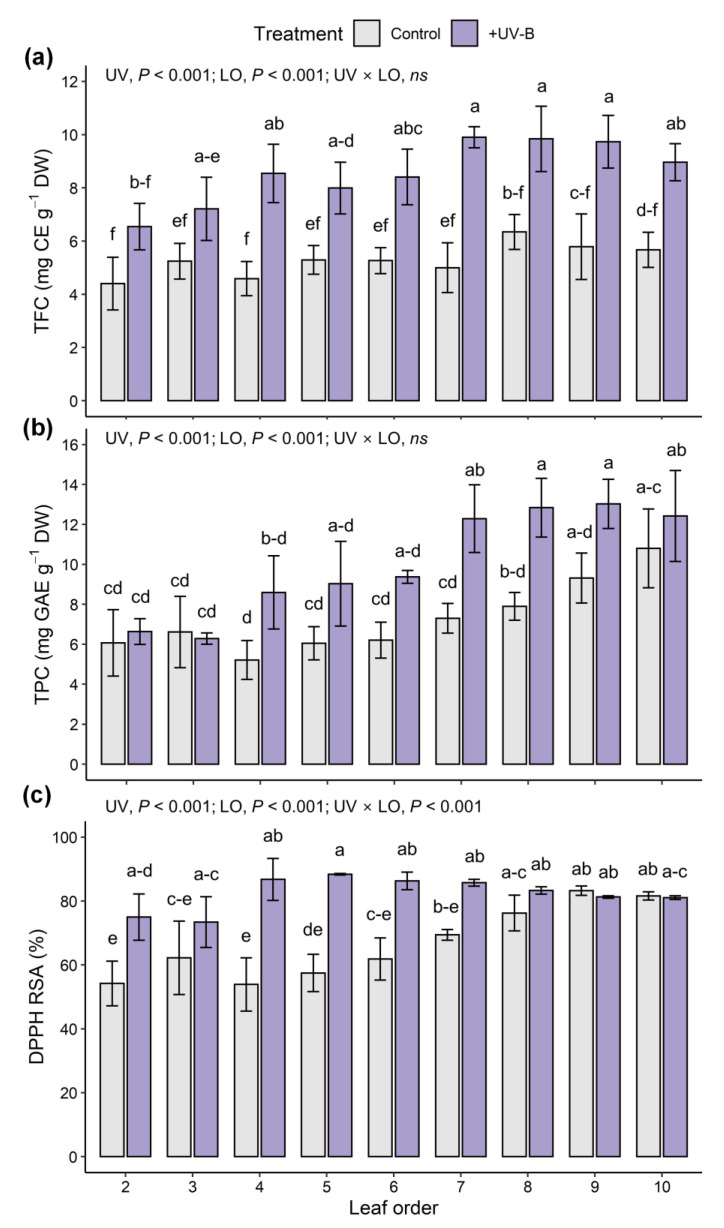
Figure 3.
Total flavonoid content (TFC, (a)), total phenolic content (TPC, (b)), and antioxidant capacity represented as DPPH radical scavenging activity (DPPH RSA, (c)) of individual leaves of kales in the control and UV-B treatments. Leaf order indicates the leaf developmental age in order from the oldest leaf at the bottom to the youngest leaf at the top in a whole plant. The p-value in two-way ANOVA was represented with UV treatment (UV) and leaf order (LO) and interactions. ns, nonsignificance. Different letters indicate significant differences at p < 0.05 for each parameter (n = 3, mean ± SD) following two-way ANOVA and Tukey’s HSD test.

