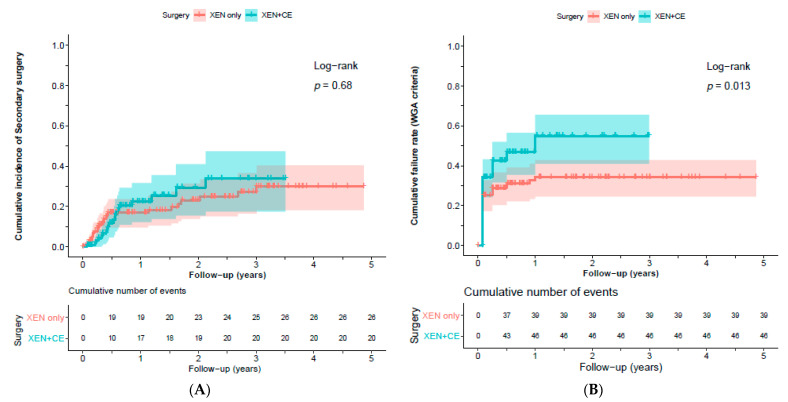
Figure 2.
Kaplan–Meier cumulative incidence curve for failure (defined as the requirement of secondary surgery (A) and according to WGA-criteria (B)) of XEN-implant as a standalone (XEN only) vs. as a combined (XEN + CE) procedure during follow-up. Censored patients are denoted by vertical tick marks. The shade around the curve represents the confidence intervals for the point estimates of the curve.

