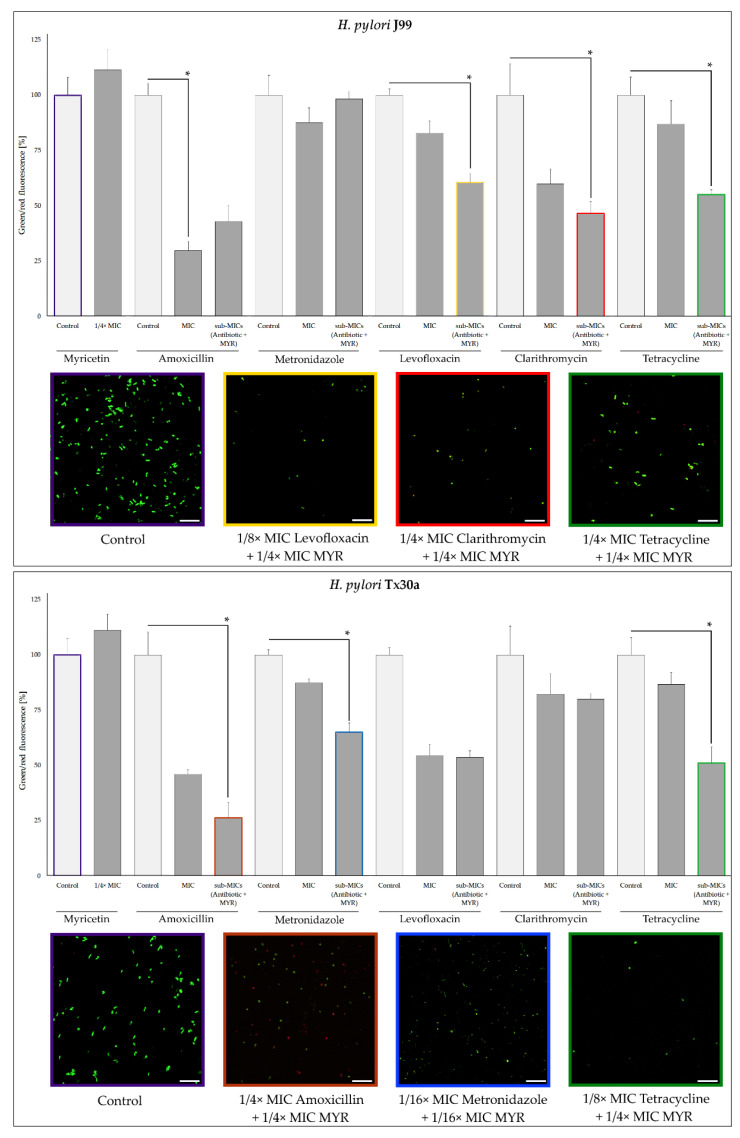
Figure 7.
Graphical representation of changes in cell viability of reference H. pylori J99 and Tx30a strains when exposed to MICs of antibiotics or a combination of sub-minimal concentrations (sub-MICs) of the selected antibiotic with 1/4× MIC of myricetin (MYR). Fluorescence in the “control” and “1/4× MIC” samples collectively labeled as “myricetin” is the mean of all other experiments, being their joint element. Bacterial cells were stained with a LIVE/DEAD kit. The scale bar shows 20 µm. Results are presented as means ± standard deviations from three independent, biological experiments. * Indicates statistically significant difference (p ≤ 0.05).

