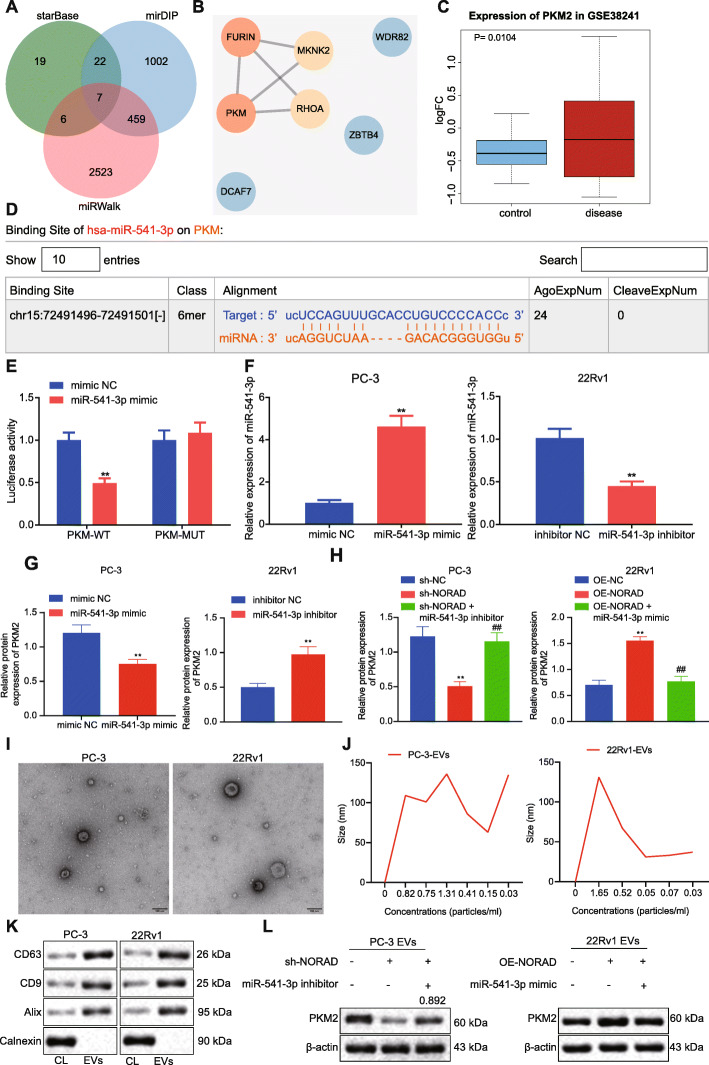
Fig. 3.
NORAD-targeted miR-541-3p regulated the expression of PKM2 in PCa cells and EVs
a, Venn diagram of predicted downstream target genes of miR-541-3p through StarBase, mirDIP, and miRWalk. b, The PPI of important downstream genes of miR-541-3p. The redder of the circle, the higher the core degree; the bluer of the circle, the lower the core degree. c, Box plot of PKM2 expression in microarray dataset GSE38241, with the blue box on the left representing the normal samples and the red box on the right representing PCa samples. d, The binding site of miR-541-3p and PKM2 predicted by starBase. e, Dual luciferase assay was performed to verify the binding of PKM2 and miR-541-3p, * p < 0.05, ** p < 0.01 vs. HEK293T treated with mimic NC. f, qRT-PCR analysis of the expression of miR-541-3p in PC-3 and 22Rv1 cells, * p < 0.05, ** p < 0.01 vs. PC-3 cells treated with mimic NC or 22Rv1 cells treated with inhibitor NC. g, Western blot analysis of the expression of PKM2 in 22Rv1 treated with miR-541-3p inhibitor and PC-3 cells treated with miR-541-3p mimic. h, Western blot analysis of the expression of PKM2 in 22Rv1 treated with OE-NORAD or miR-541-3p mimic and PC-3 cells treated with sh-NORAD or miR-541-3p inhibitor. i, Representative images of the morphology of EVs under a transmission electron microscopy (Scale bar, 100 nm). j, The size distribution of EVs through NTA. k, The expression of specific surface marker protein in EVs was detected by Western blot. l, The expression of PKM2 in EVs derived from PCa cells was detected by Western blot. * p < 0.05, ** p < 0.01 vs. PC-3 cells treated with sh-NC + inhibitor NC or 22Rv1 treated with vector + mimic NC; # p < 0.05, ## p < 0.05 vs. PC-3 cells treated with sh-NORAD + inhibitor NC or 22Rv1 treated with OE-NORAD + mimic NC. The measurement data were expressed as mean ± standard deviation. Independent t-test was used for comparison between two groups. ANOVA was used for comparison between multiple groups with Tukey’s post-hoc test. The cell experiment was repeated 3 times

