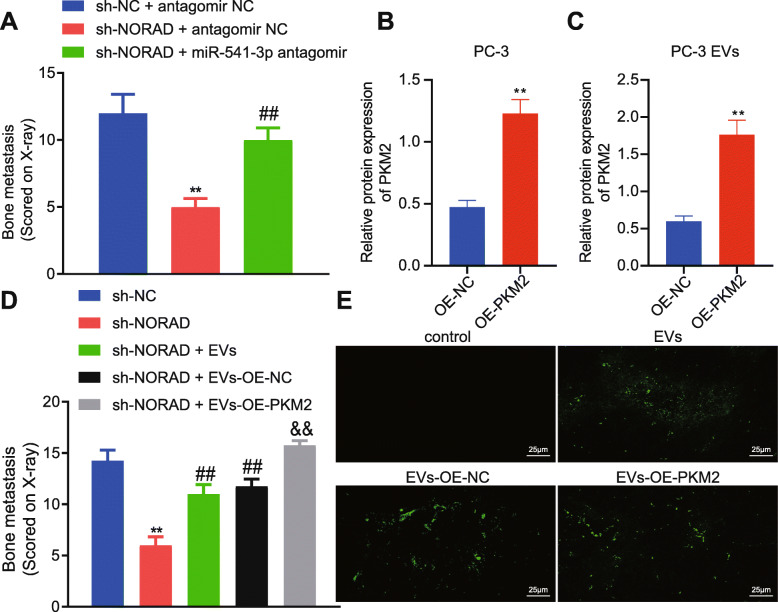
Fig. 7.
NORAD/miR-541-3p/EVs-PKM2 promoted bone metastasis of PCa cells in vivo
a, The sum of bone metastasis scores of each mouse (N = 8). * p < 0.05, ** p < 0.01 vs. mice treated with sh-NC + antagomir NC; # p < 0.05, ## p < 0.01 vs. mice treated with sh-NORAD + antagomir NC. b, The expression of PKM2 in PC-3 cells transfected with OE-PKM2 was detected by Western blot. c, The expression of PKM2 in EVs from PC-3 cells transfected with OE-PKM2 was detected by Western blot. d, The sum of bone metastasis scores of each mouse treated with EVs with highly expressed PKM2 (N = 8) (× 400). * p < 0.05, ** p < 0.01 vs. mice treated with sh-NC; # p < 0.05, ## p < 0.01 vs. mice treated with sh-NORAD; & p < 0.05, && p < 0.01 vs. mice treated with sh-NORAD + OE-NC. e, Representative images of mouse bone marrow 24 hours after intravenous injection of fluorescein-labeled EVs. Scale bar, 25 µm; green, PKH67. The measurement data were expressed as mean ± standard deviation. Unpaired t-test was used for other two groups; ANOVA was used for comparison between multiple groups with Tukey’s post-hoc test. The cell experiment was repeated 3 times

