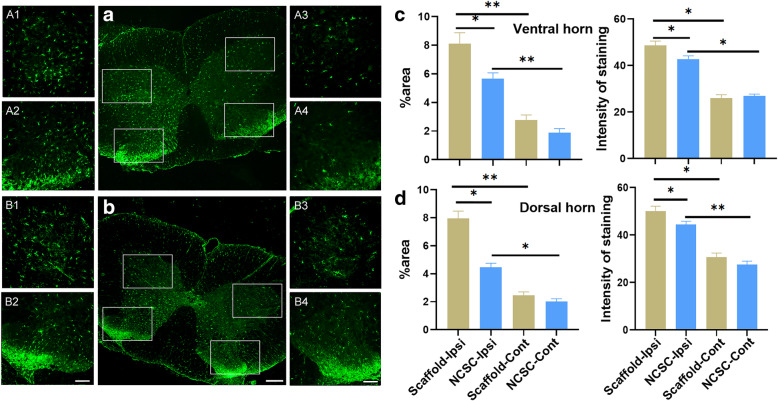
Fig. 4.
Iba-1 expression by immunofluorescence between two groups. The representative image of staining in the scaffold group (a) and the NCSC group (b). (A1–4) and (B1–4) are the respective magnification of the images in the white frame. (A1–2) and (B1–2) are the ipsilateral side and (A3–4) and (B3–4) are the contralateral side. Quantification of area percentage and averaged intensity of staining in the ventral (c) and dorsal horn (d). The microglia were activated after SNT and the activation were significantly attenuated by NCSCs treatment. a and b, × 50, scale bar is 300 μm; (A1–A4) and (B1–B4), × 200, scale bar is 100 μm. *p < 0.05, **p < 0.01, N = 4

