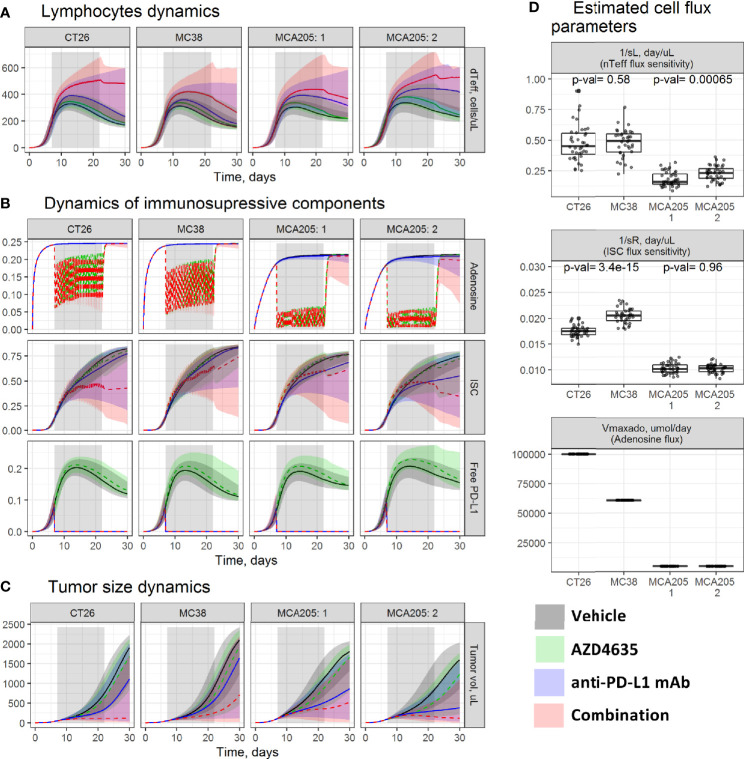
Figure 2.
Evaluation of tumor microenvironment (TME) dynamics across experiments. Model-based simulations of (A) dTeff; (B) key immunosuppressive TME components; and (C) tumor size dynamics across studies. Lines—median prediction, area—90% prediction interval (PI). Different treatment regimens are shown by color. (D) Boxplots of the estimated parameters across studies. P-values were calculated using the Wilcoxon test. MCA205 experiments: 1—an efficacy study; 2—a dose-finding study.

