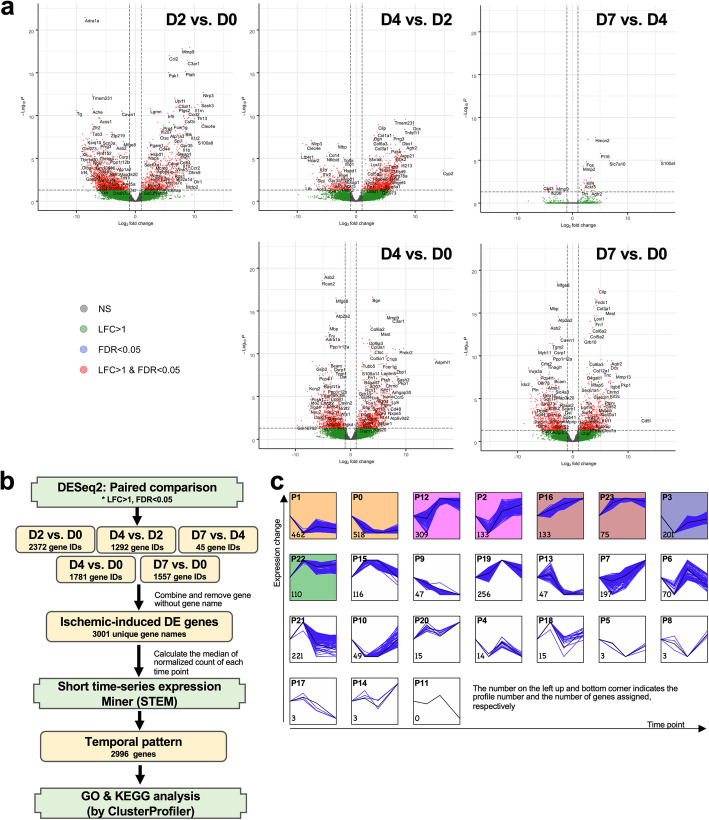
Fig. 3.
Differentially expressed genes in response to ischemia in pericytes. a The volcano plots show the DE genes with a log fold change (LFC) > 1 and/or false discovery rate (FDR) < 0.05. b The strategy used to analyze the dynamics of DE genes at different time points after ischemia. c The result of STEM analyses. The profile number and assigned gene number are indicated at the top left and bottom corners, respectively. The number of RNA samples/libraries used for the RNA-seq analysis at ischemia D0, D2, D4, and D7 was 6, 5, 8, and 8, respectively

