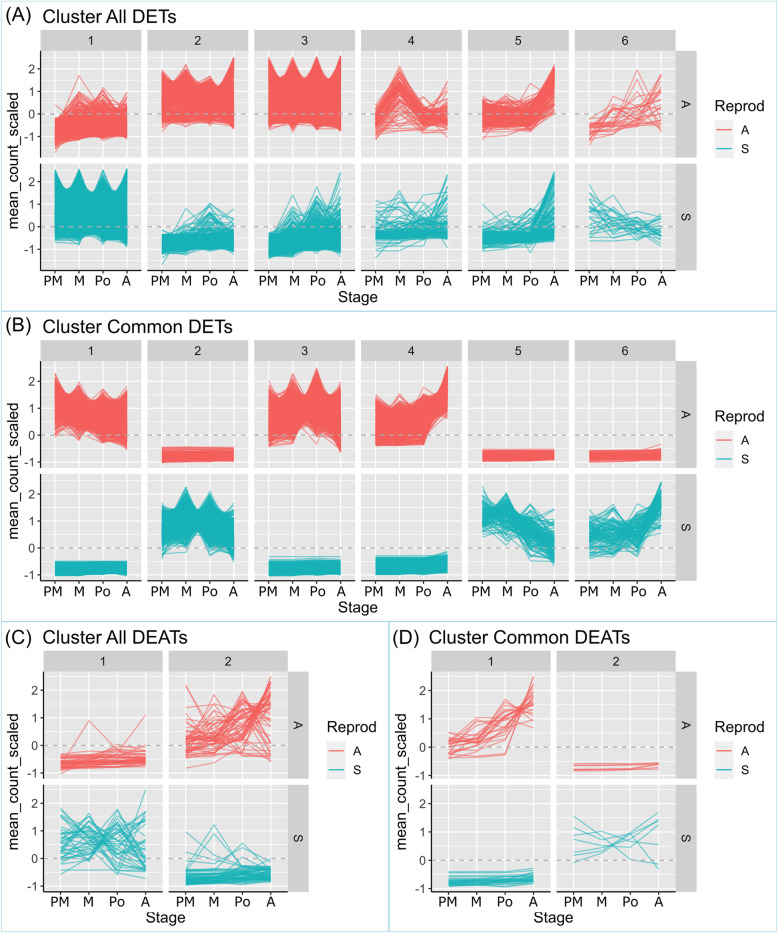
Fig. 5.
Transcript expression dynamics in clusters of selected genes. Clusters of transcripts showing similar expression, derived from: a the total (all) DETs raw counts matrix; b the common DETs raw counts matrix (common DETS are sense transcripts differentially expressed at all stages); c the total (all) DEATs raw counts matrix; d the common DEATs raw counts matrix (common DEATs are antisense transcripts differentially expressed at all stages). Vertical axis: mean counts (scaled) of the triplicate libraries. Horizontal axis: developmental stages: P: premeiosis; M: meiosis; Po: postmeiosis; A: anthesis

