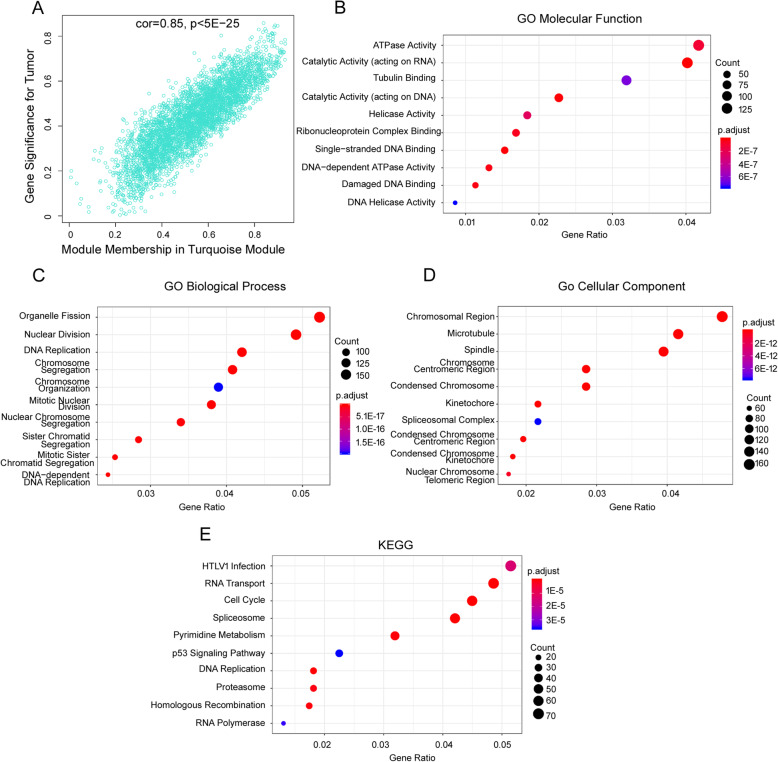
Fig. 4.
Functional Enrichment and Pathway Analysis of the Key Module Genes. a Relationship between module membership in turquoise module and gene significance for tumor. b GO MF molecular function enrichment analysis result of turquoise module genes. c GO BP biological process enrichment analysis result of turquoise module genes. d GO CC cellular component enrichment analysis result of turquoise module genes. e KEGG enrichment analysis results of turquoise module genes. Pathway names are shown on the left. The size of the round represented the number of genes enriched in the corresponding pathway. The color of the round represented the adjusted p value

