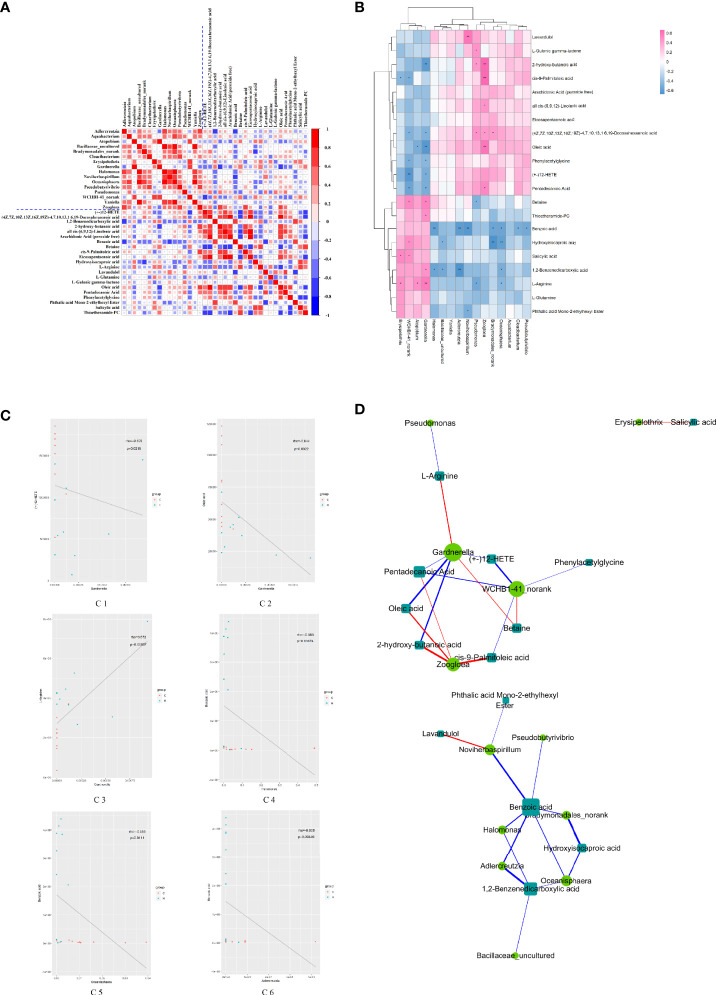
Figure 4.
Relationship between vaginal microorganisms and serum metabolites. (A) Correlation coefficient matrix thermograph illustrating the functional correlation between perturbed vaginal microbiota and altered serum levels of metabolites. With the blue dotted line in the picture as the dividing line, it is divided into four quadrants. The upper left corner shows the correlation between the significantly different Vaginal flora, and the lower right corner shows the correlation between the significantly different metabolites. Both the upper right corner and the lower left corner show the correlation between the significantly different flora and metabolites (mirror image symmetry). The correlation coefficient r is expressed by color, r > 0 means positive correlation (red), and r < 0 means negative correlation (blue). The darker the color, the stronger the correlation. (B) Heat map summarizing the correlation between perturbed vaginal microbiota and altered serum levels of metabolites. *P value < 0.05, **P value < 0.01. (C) Scatter plots showing a statistical correlation between the relative abundance of altered vaginal bacteria and the mass spectrum intensities of some typical serum metabolites. (D1) Between Gardnerella and (+-) 12-HETE, (D2) between Gardnerella and oleic acid, (D3) between Gardnerella and L-arginine, (D4) between Halomonas and benzoic acid, (D5) between Oceanisphaera and benzoic acid, and (D6) between Adlercreulzia and benzoic acid. In the graph, the scattered dots represent the samples, and the colors correspond to different groupings. Rho is the Spearman correlation coefficient between the relative microbiota abundance and the metabolite intensity. The P value is the significant level of the rho. In (A–C), blue represents negative correlation (r < 0), and red represents positive correlation (r > 0); the darker the color, the stronger the correlation. (D) Network diagram of the correlation between vaginal microbiota and serum levels of metabolites. The microbiota and metabolites with absolute correlation coefficient [0.3, 1] were analyzed by the Spearman correlation network. The circle represents the altered bacteria, and the rectangle represents the altered serum levels of metabolites. The thickness of the line is proportional to the absolute value of the correlation coefficient. The node size positively correlates with its degree, that is, the greater the degree, the larger the node size.

