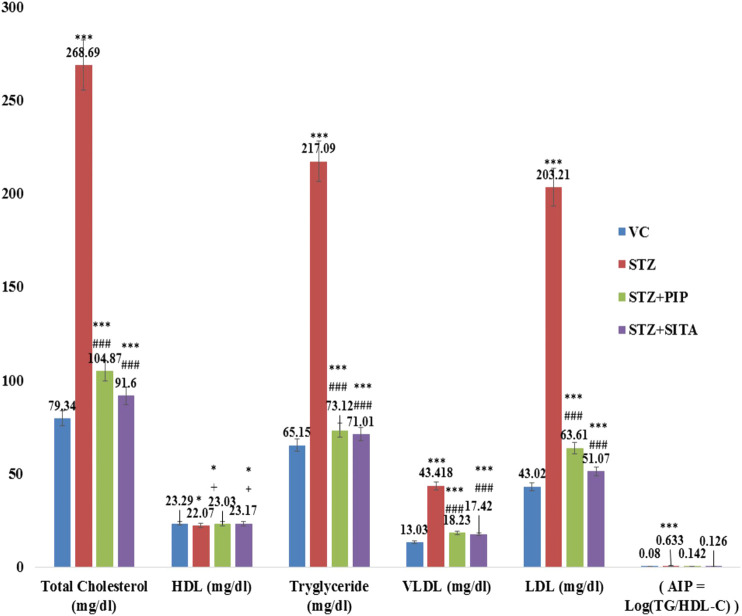
FIGURE 4.
Effect of the piperine on lipid profile and AI (Atherogenic Index) (Data are means ± S.E.M. (n = 7); *, p ≤ 0.05 and c, *** ≤ 0.001 as compared to the respective control values and g, ### ≤ 0.001 and d = non-significant as compared to the respective values of the diabetic control group). Blue-Vehicle Control (VC); Red-Diabetic control (STZ); Green-Piperine treatment (STZ + PIP); Purple-Sitagliptin treatment (STZ + SITA).

