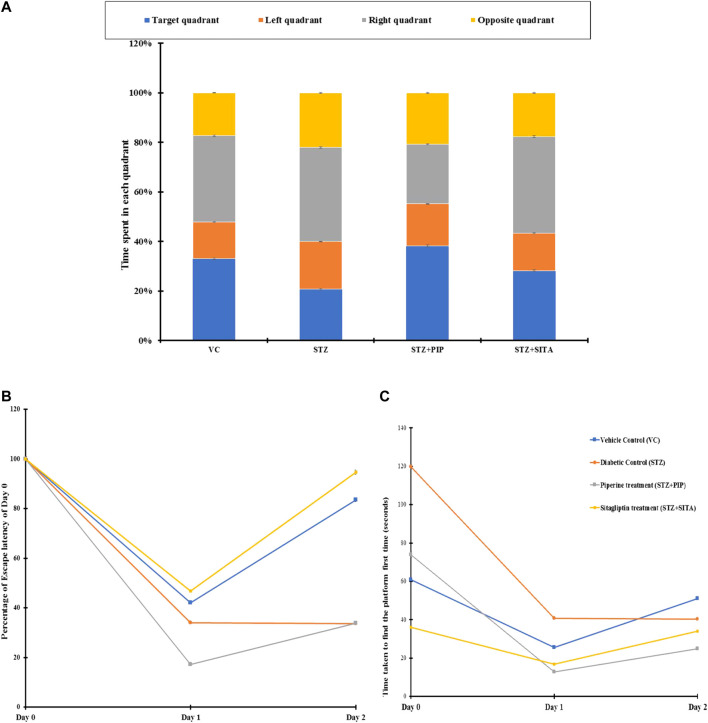
FIGURE 5.
(A) Percentage distribution of time spent by the animals in different quadrants in search of the hidden platform (probe test) in MWM. Figure 5B. Day wise changes in time required to find the hidden platform when the animals were released on the opposite quadrant of MWM. Vehicle control (VC); Diabetic control (STZ); Piperine treatment (STZ + PIP); Sitagliptin treatment (STZ + SITA). Figure 5C. Changes in escape latency after 24 h (Day 1) and 48 h (Day 2) in different groups of animals in comparison to their respective first-time exposure (Day 0) to MWM. Vehicle control (VC); Red-Diabetic control (STZ); Green-Piperine treatment (STZ + PIP); Purple-Sitagliptin treatment (STZ + SITA).

