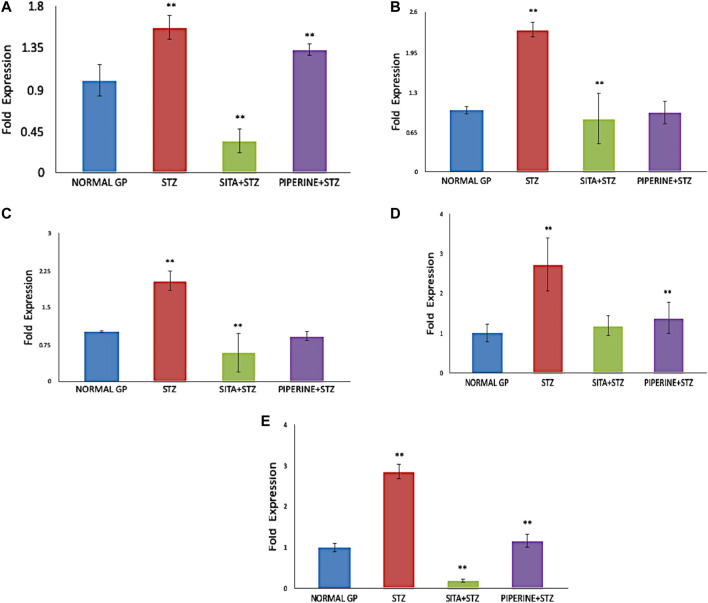
FIGURE 9.
Gene Expression analysis in the cerebral cortex brain tissue of rat (NORMAL GP = Control group; STZ = Streptozotocin treated group; SITA + STZ = Streptozotocin and sitagliptin treated group; PIPERINE + STZ = Streptozotocin and piperine treated group). In compared to the untreated control group, the expression of BACE1, PSEN1, APAF1, CASPASE3, and CATALASE genes were significantly upregulated (p ≤ 0.05) in STZ treated group (Diabetes control). However, when the STZ treated group (Diabetes control) was treated with either sitagliptin (Positive control) or piperine, the expression of all the five genes were significantly down-regulated (p ≤ 0.05). Data are presented as mean ± SD. **p < 0.01 with the control (NORMAL GP).

