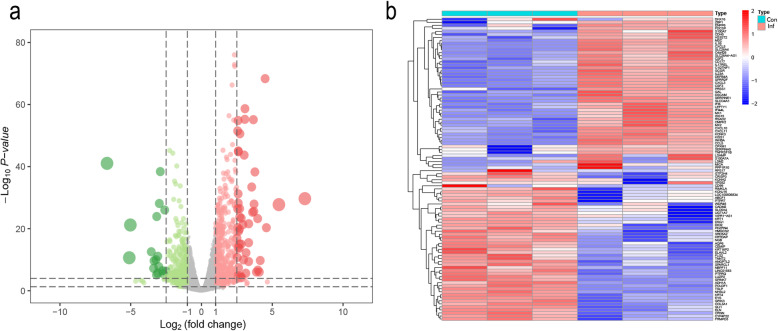
Fig. 1.
Heat map (a) and volcano plot (b) of the differentially expressed genes (DEGs). a Heat map of DEGs. The abscissa axis represents sample types and the ordinate axis represents gene names. b Volcanic plot analysis of upregulated genes and downregulated genes in infected and control groups. In total, 966 DEGs, including 490 upregulated and 476 downregulated DEGs, were identified in the GSE150819 when comparing the infected group and control group. Red indicates log2FC>1 while green indicates log2FC<−1, which means different gene expression between two groups (red for upregulated DEGs and green for downregulated DEGs). And gray indicates no difference

