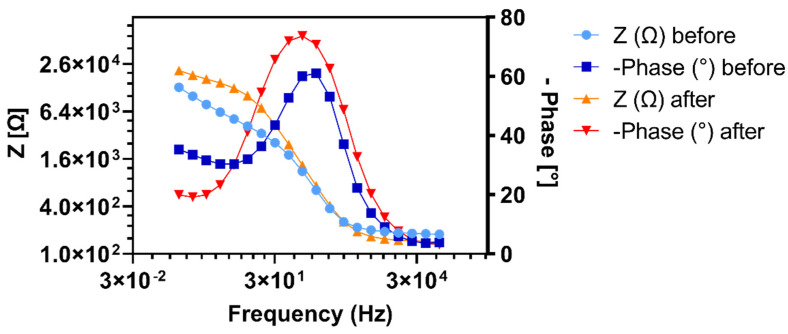
Figure 3.
Bode plot EIS spectra of the same electrodes as shown in Figure 2b with the phase shift (dark blue) and absolute values of the impedance (light blue) of the unmodified, bare gold electrode plotted against the tested frequencies and the phase shift (red) and absolute values of the impedance (orange) of an electrode tested after functionalization with the HB-PNIPAM-Van-C polymer without an initial baseline EIS measurement.

