Figure 8.
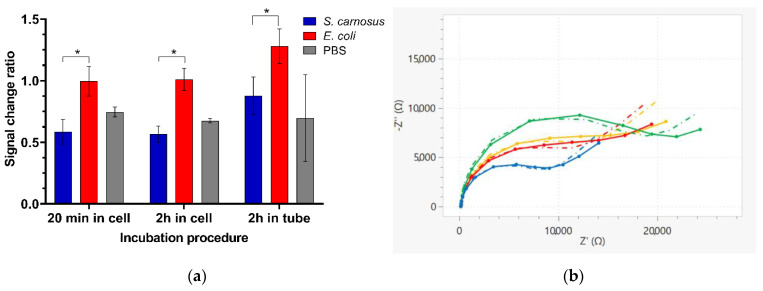
(a) Rct signal change ratio after incubation of vancomycin-modified highly branched polymer HB-PNIPAM-Van-C functionalized electrodes with S. carnosus and E. coli suspensions in PBS (OD600 = 0.1) and with PBS buffer alone for 20 min or 2 h in the measurement cell with 80 µL sample volume or in a 15 mL reaction tube with the electrodes covered with 3.5 mL bacteria solution at 30 °C, respectively; results presented as a ratio of mean Rct for an electrode after incubation with the target relative to the same value before incubation; data are presented as mean ± SEM; significance was determined using ANOVA multiple comparison tests; * p < 0.05; n = 4. (b) Nyquist plot EIS spectra of HB-PNIPAM-Van-C functionalized electrodes tested with S. carnosus (green: before incubation with S. carnosus; blue: after incubation) and E. coli (orange: before incubation with E. coli; red: after) (OD600 = 0.1, 2 h incubation in measurement cell). The dash-dotted lines at the matched colours represent the fitted data based on the Randles equivalent circuit.

