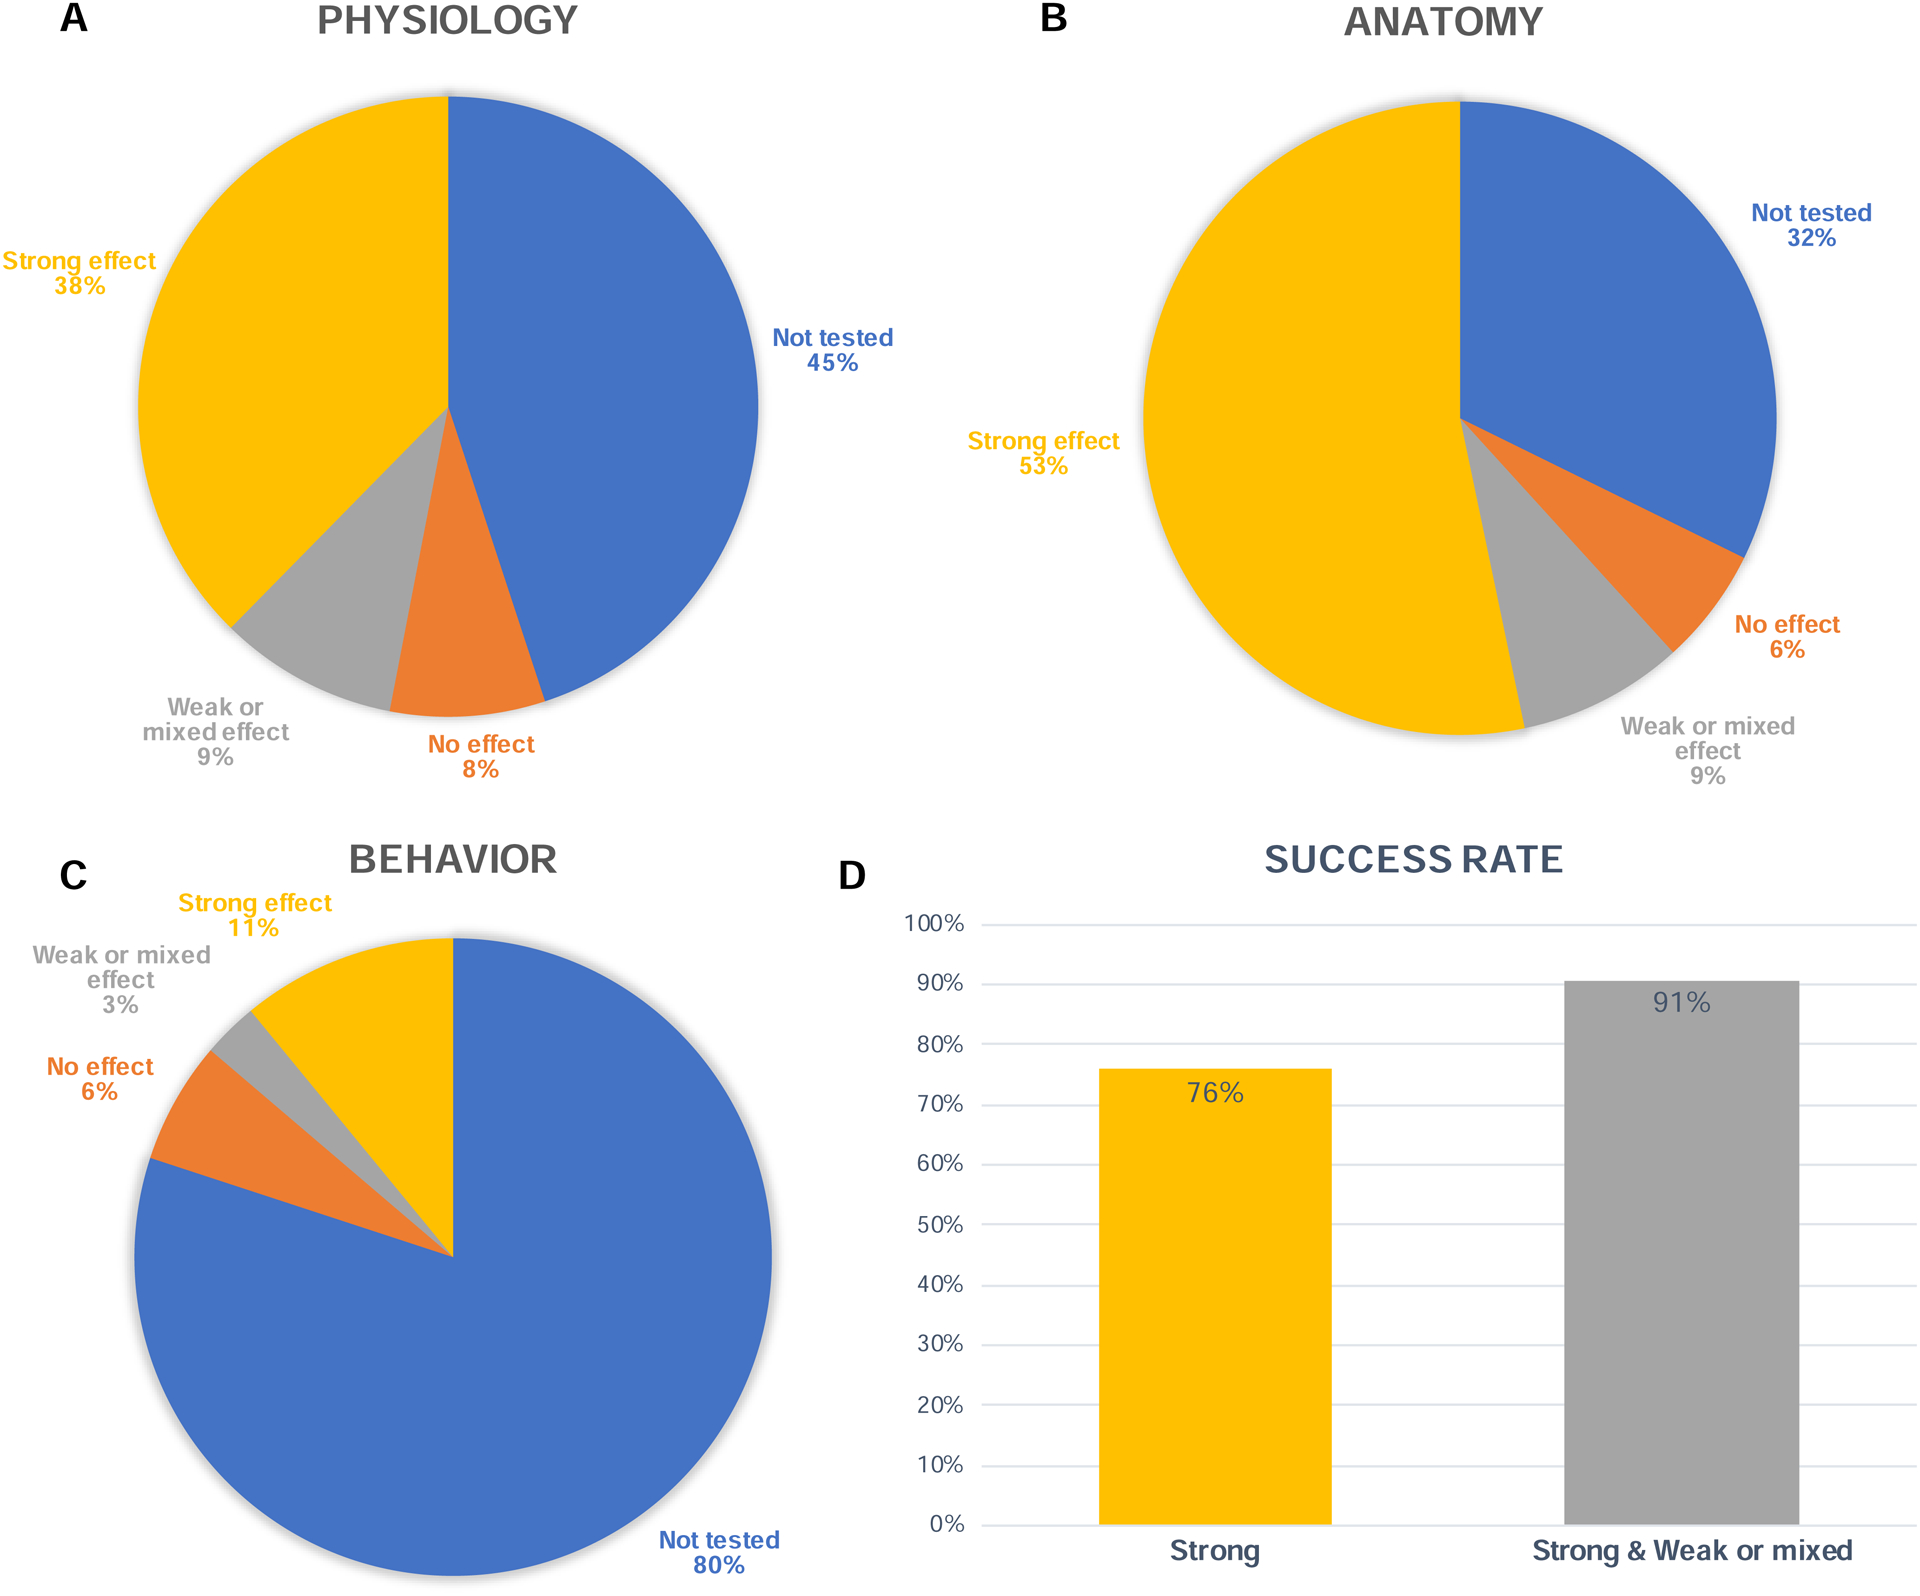
Figure 4. Outcome of optogenetics experiments in NHP.

A) Proportion of injections that led to a strong physiological effect, a weak or mixed effect, or no effect. A weak or mixed effect was defined as per the investigators’ comments reporting either weak, unreliable, or mixed physiological response. White numbers represent absolute number of injection tests. B & C) Same as in A, but for anatomical and behavioral analyses, respectively. D) Left: Proportion of injections that led to at least one strong outcome across all three possible outcome modalities (physiology, anatomy, or behavior). Right: This bar also includes injections that led to at least one weak or mixed outcome (or better), across all three outcome modalities.
