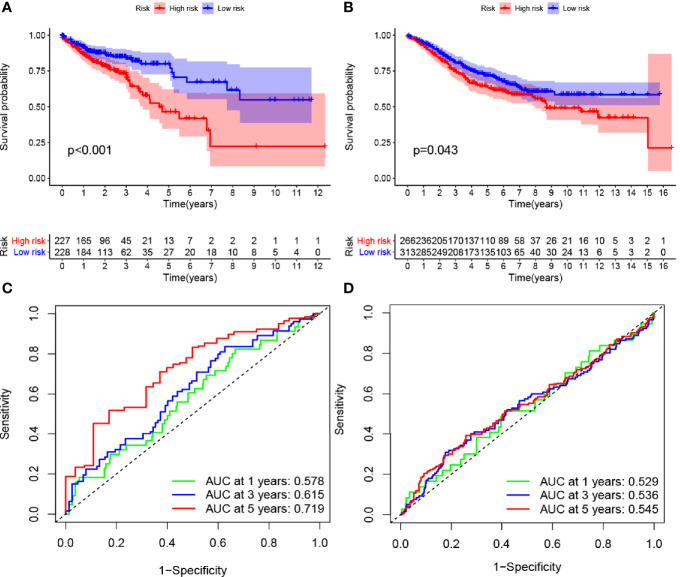
Figure 2.
Effects of the hypoxia model on patient prognosis. (A, B) Kaplan–Meier survival curves for patients with colon cancer in The Cancer Genome Atlas and Gene Expression Omnibus databases, stratified according to risk scores (high vs. low); comparisons of the median survival time in both groups with log-rank tests (p<0.01 and p = 0.043, respectively). (C, D) Receiver operating characteristic curve analysis of the prognostic accuracy of the model.

