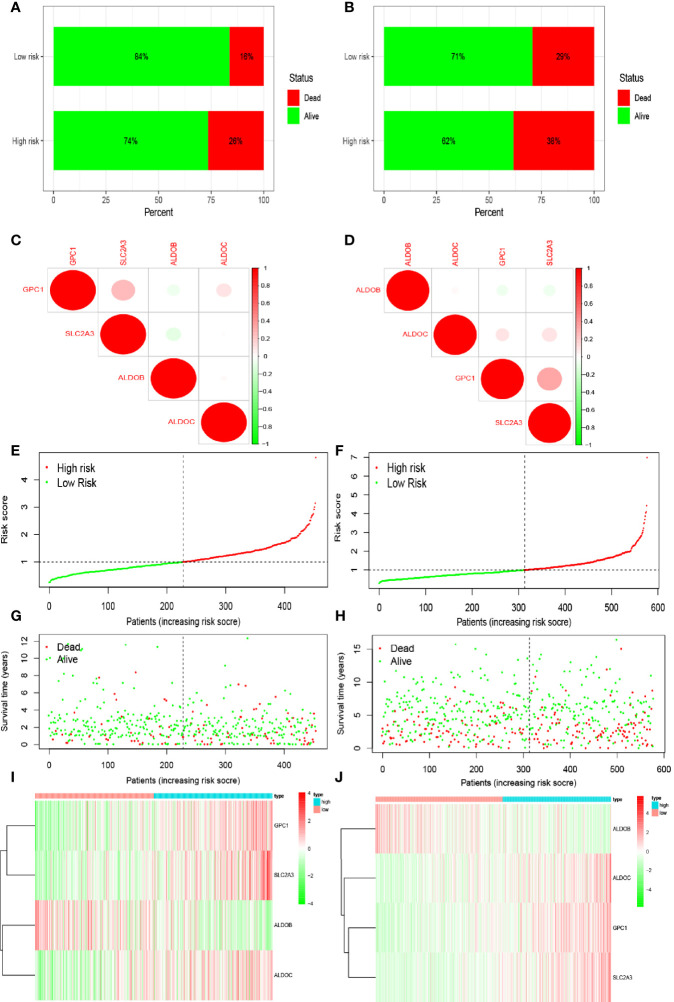
Figure 3.
Prediction of patient risk in the hypoxia model and the expression levels of the genes included in the model. (A, B) Patient survival in The Cancer Genome Atlas (TCGA) and Gene Expression Omnibus (GEO) databases. (C, D) Correlations between the genes included in the risk model based on TCGA and GEO databases. Positive and negative correlations are indicated in red and green, respectively. (E, F) Patient risk scores in TCGA and GEO databases. (G, H) Survival rates in the high- and low-risk patient groups in TCGA and GEO databases. (I, J) Heat maps of gene expression levels in the risk model for the high- and low-risk groups in TCGA and GEO databases.

