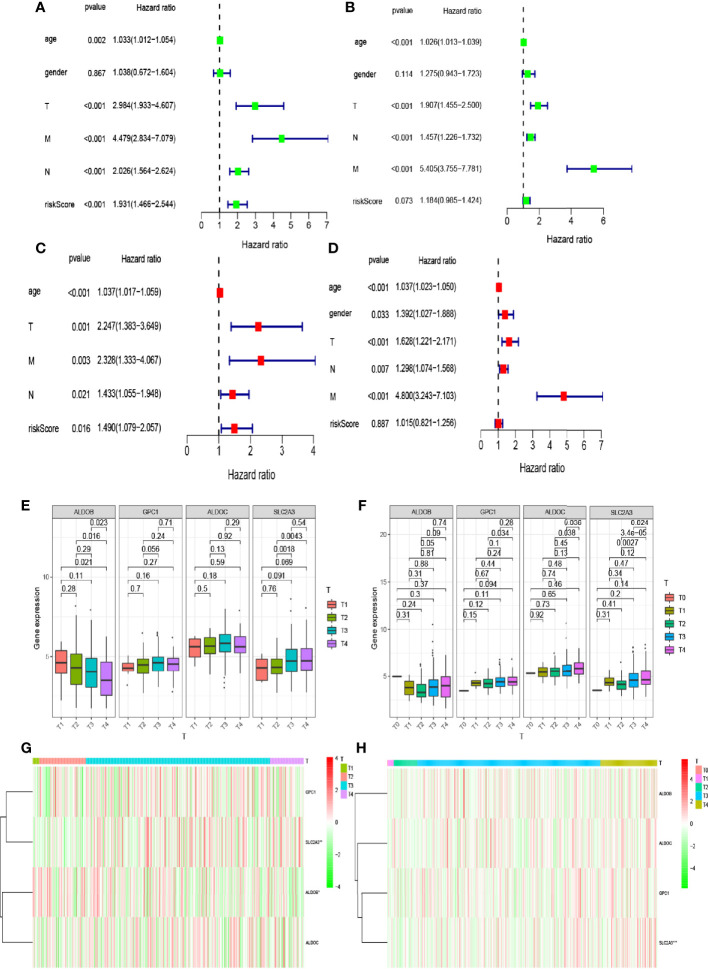
Figure 4.
Relationship between the risk model and clinical factors. (A, B) Single-factor prognostic analysis included age, sex, tumor–node–metastasis (TNM) stage, and the risk scores of patients with colorectal cancer in The Cancer Genome Atlas (TCGA) and Gene Expression Omnibus (GEO) databases. (C, D) Multifactor prognostic analysis included age, sex, TNM stage, and the risk scores of patients with colorectal cancer in TCGA and GEO databases. (E, F) Comparisons of the expression levels of various genes in the hypoxia model in TCGA and GEO databases for different T stages. (G, H) Heat maps showing the expression levels of genes in the risk model in TCGA and GEO databases for different T stages.

