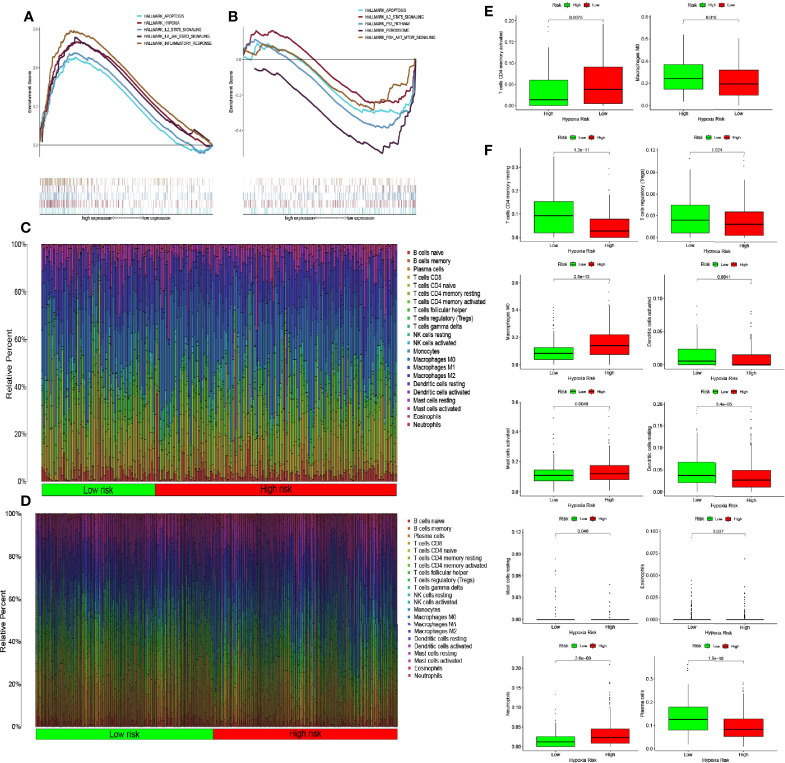
Figure 5.
Enrichment of hypoxia pathways and infiltration of hypoxia-related immune cells. (A) Enriched gene sets in the HALLMARK collection according to high-risk scores in The Cancer Genome Atlas (TCGA) database. Each line represents one particular gene set with a unique color, with upregulated genes appearing on the left side approaching the origin of the coordinates and downregulated genes appearing on the right side of the x-axis. Only gene sets with nominal (NOM) p-values <0.05 and false discovery rate (FDR) q values <0.06 were considered statistically significant. A selection of leading gene sets is shown in the plot. (B) The enriched gene sets in the HALLMARK collection by low-risk scores in the Gene Expression Omnibus (GEO) database. Only gene sets with NOM p-values <0.05 and FDR q values of <0.06 were considered statistically significant. A selection of leading gene sets is shown in the plot. (C, D) Heat map of hypoxia risk and immune cell infiltration in TCGA and GEO databases. (E) Immune cells whose infiltration is significantly associated with the risk of hypoxia in TCGA database (p < 0.05). (F) Immune cells whose infiltration is significantly associated with the risk of hypoxia in the GEO database (p < 0.05).

