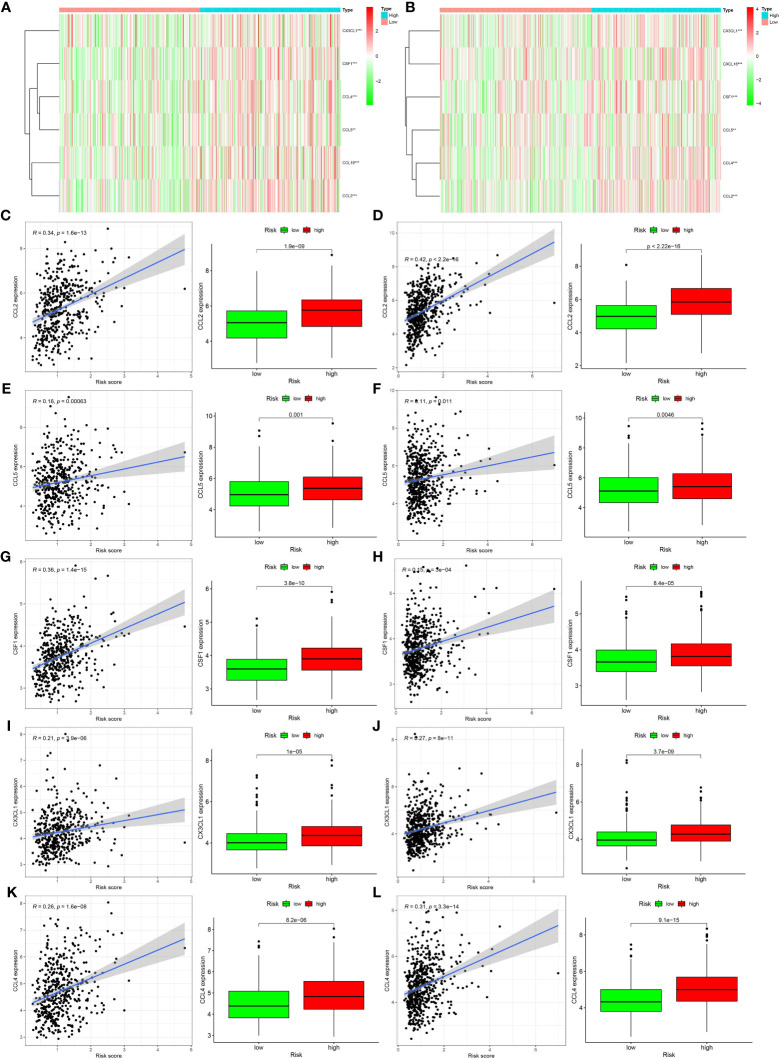
Figure 6.
Relationships between genes regulating immune cell behavior and hypoxia risk. (A, B) Heat maps showing the expression levels of genes regulating activated CD4 memory T cells and M0 macrophages in different hypoxia risk groups (**p < 0.01; ***p < 0.001). (C–L) Scatter plots showing the correlations of the expression of four genes from The Cancer Genome Atlas and Gene Expression Omnibus databases with immune cell regulation, showing differences in the expression levels between the different hypoxia risk groups (p < 0.05). The blue line in each plot is a fitted linear model indicating the relationship between gene expression and the risk of hypoxia. Pearson coefficients were used to assess the correlation between the two factors. The box plots show the differences in the levels of gene expression between groups at risk of hypoxia (p < 0.05).

